 Charles Schwab
 Fidelity
 Interactive Brokers
 E*TRADE
 Webull
 TradeStation
 tastytrade
 eToro
eToro Trading 212
 Interactive Investor
 IG
IG Interactive Brokers
 XTB
XTB Hargreaves Lansdown
 Saxo
Saxo Charles Stanley Direct
 CIBC Investor's Edge
 Interactive Brokers
 Moomoo
 Questrade
 Qtrade
 TD Direct Investing
 Wealthsimple
 Finviz
 Stock Rover
 Seeking Alpha
 StockHero
 TipRanks
 TrendSpider
 Trade Ideas
 TraderSync
 TradingView
 Tradervue
 TradeZella
Best Stock Screeners 2026: Free & Paid

Written by Blain Reinkensmeyer
Managing Partner

Edited by Hannah Smith
Staff Editor

Fact-checked by Steven Hatzakis
Director of Online Broker Research
Blain ReinkensmeyerManaging Partner
Blain Reinkensmeyer heads research for all U.S.-based brokerages on StockBrokers.com. He has more than 25 years of trading experience and has been featured in the New York Times, Wall Street Journal, and Forbes, among other media outlets.

The best free stock screeners and scanners are TradingView, ChartMill, and Stock Rover. These platforms lead the market by combining fundamental and technical filters with advanced charting, automated pattern recognition, and user-friendly data visualizations.
Searching for new stock ideas doesn’t have to be a chore if you use a great screener. The best stock screeners and scanners make it easy to rapidly sift through thousands of stocks and identify a dozen or so opportunities that fit your market view and trading style, whether you’re investing long term or looking for short-term movers for day trading.
Best Stock Screeners
 How Blain tested for the best stock screener
My list focuses on the best stock screeners and scanners available to stock traders and casual investors. I evaluated the depth of filter criteria, selection of both fundamental and technical filters, ease of use, and any extra functionality that I think complements a good screener. I included some solid screeners that, while not free, are well worth a look.
To choose the best stock screener of the group, I focused on tools that make it easy to filter thousands of stocks using both fundamental and technical criteria. I also looked for platforms with intuitive interfaces, useful presets, and additional features like charting, alerts, or integrations that help traders and investors quickly turn screening results into actionable ideas.
- Free version: Yes
- Monthly Pricing: $14.95/mo
- Annual Pricing: $155.40/yr
TradingView is my favorite site for stock and ETF screening because it offers the best overall combination of quality data and ease of use. It’s visually appealing and its prolific dropdowns make it very efficient. Read full review
- Charting powerhouse: 400+ indicators, 110+ drawing tools
- Easy signup; under a minute
- Active social network for ideas and user strategies
- Free plan has ads and limits multi-chart/advanced indicators
- Frequent upgrade prompts on free plan
- Education exists, but little in-platform guidance
- Free version: Yes
- Monthly Pricing: $34.97/mo
- Annual Pricing: $299.97/yr
ChartMill will hold a lot of appeal for casual traders. It’s more basic than my top pick but still offers most popular screening options, and it’s intuitive and fun to use.
- ChartMill is intuitive to use
- Good selection of fundamental filters
- Traditional and candlestick pattern recognition
- ChartMill is a bit pricey at $299.97/year (or, $34.97/month)
- There used to be a free trial, but it hasn't been an option for years
- Free version: Yes
- Monthly Pricing: Starts at $34.00/mo
- Annual Pricing: Starts at $348.00/yr
While a free version is available, Stock Rover is best suited for those who demand more than what their broker can offer and are willing to pay for it. There’s an extensive selection of tools and variables to conduct analysis and research. Read full review
- Screener with 700+ criteria for stocks, ETFs, funds
- 14-day trial on all paid plans
- Weekly screener ideas and ratings
- Steep learning curve
- No international markets or crypto
- Research reports cost extra ($49.99–$99.99/yr)
- Free version: Yes
- Monthly Pricing: $39.50/mo
- Annual Pricing: $299.50/yr
The FINVIZ.com stock screener stands out for its large selection of fundamental stock criteria and overall functionality, and it can present fundamental data visually. There’s a large selection of fundamental and technical criteria, and the interface is user-friendly. Read full review
- Top-tier stock screener, powerful yet simple
- Visual news, charts, and financials
- Intuitive and fun once learned
- Limited education; no chatbot
- Can feel overwhelming at first
- Free plan has ads and delayed data
- Free version: Yes
- Monthly Pricing: N/A
- Annual Pricing: $299.00/yr
Seeking Alpha offers a wide variety of data and services, but they now come only with a paid membership. Its screener’s strength is in its stock ratings, preset screens and contributor opinions. Read full review
- Excellent preset screens
- Contributor ratings are unique
- The workflow to create custom screens is annoying
- There are only a few chart/price action filters
1. TradingView - Best free stock screener
TradingView is my pick for the best free stock screener. TradingView has dedicated screeners for stocks, bonds, ETFs, and cryptocurrency coins, plus CEX and DEX pairs. Screeners are integrated into TradingView’s overall platform suite, which includes charting and trading and supports connectivity with some of the best online stock brokers. TradingView also has a highly polished mobile charting app. The mobile app does not include the stock screener, so screens have to be run on the web or desktop version.
Ease of use: TradingView balances powerful features with ease of use. There’s a vast selection of technical and fundamental indicators. You don’t often find indicators in a typical stock screener. Customizing data ranges is a breeze. You can sort columns, add additional parameters, and switch instantly between table and chart view.
Features: Traders who want to research specific company metrics, like dividends per share, yield percentage, or financial metrics such as EPS estimates, will find hundreds of such parameters that can be added to each screener layout. The presets are useful enough that you might not even need to create custom screens.
TradingView’s overall blend of features makes it my go-to site for free stock charts and free stock screening. It delivers quality fundamental and technical data in an easy-to-use platform experience.
For a full run down on all of its features and pricing, check out our complete TradingView review.
- Pros: TradingView’s fully featured stock screener has an excellent selection of fundamental data and an outstanding array of technical data. The free version is very functional for most investors.
- Cons: TradingView has a mobile app, but it doesn’t include a screener. Data exports and streaming real-time quotes require a paid plan.
Free version includes: Access to stock, ETF, crypto, and bond screeners for U.S. equities, built-in screen presets, one chart per layout, up to 30 symbols per watchlist, 3 active price alerts, and 2 technical indicators per chart. You can also save screen filters, but data export is not included.
Paid versions and cost: TradingView has a free Basic plan and four paid plans. Only the Ultimate plan is available to professional users. Essential, Plus, and Premium come with a 30-day free trial, and Ultimate comes with a 14-day trial. Paying annually saves up to 17%.
| Plan | Price (Monthly) | Price (Yearly) |
|---|---|---|
| Basic | Free | Free |
| Essential | $14.95/month | $155.40/year |
| Plus | $34.95/month | $359.40/year |
| Premium | $69.95/month | $719.40/year |
| Ultimate | $239.95/month | $2,399.40/year |

TradingView's free stock screener shows real-time market data alongside customizable filters for a simple, streamlined research experience.
2. ChartMill - Best for casual traders
| Company | Overall | Free version | Monthly Pricing |
 ChartMill ChartMill
|
|
Yes | $34.97/mo |
If you’re intimidated by TradingView and want a simpler screener that still gives you a decent amount of technical filters, ChartMill offers a perfect compromise between ease of use and useful indicators. I could easily imagine ChartMill as being indispensable to many casual traders and beginner investors (see our picks for the best brokers for beginners if you are just getting started or learning how to invest in stocks). ChartMill runs primarily through its web platform and doesn't currently offer a dedicated stock screener app, which may matter for traders who prefer mobile tools.
Finding appealing stocks with ChartMill is as simple as moving a few sliders and ticking a few boxes. If you don’t want to come up with your own definition of what makes a stock cheap or safe, ChartMill also has proprietary ratings and preset screens. The chart views are laid out in a logical fashion, and screen results pop up quickly.
- Pros: ChartMill is intuitive to use. There’s a good selection of fundamental filters, but not so many that it becomes overwhelming. Both traditional and candlestick pattern recognition are supported.
- Cons: ChartMill is a bit pricey. Fees at ChartMill are split into two types of subscriptions: Annual and Monthly. As expected, you'll save some money by committing to an annual subscription at $299.97/year. If you want to go month-to-month, it'll cost $34.97/month.
Free version includes: Daily usage of stock screeners with access to technical indicators, fundamental filters, candlestick pattern detection, proprietary ratings (e.g., valuation, growth, momentum), preset screen templates, and interactive chart previews. You’re allowed roughly 6-10 screen runs per day, depending on account activity. Note that the site does require you to register an account with an e-mail address to use the free tier.
Cost
A subscription at ChartMill grants unlimited access to all features. There are two types of subscriptions: Annual and Monthly. Here's a price breakdown:
| Plan | Price (Monthly) | Price (Yearly) |
|---|---|---|
| Monthly Subscription | $34.97/month | $419.64/year |
| Annual Subscription | $25.00/month | $299.97/year |
3. Stock Rover - Best for research-focused investors
Stock Rover, a subscription-based web platform, offers features including screeners, portfolios, and watch lists, which are grouped under collections. Much more is packed under the hood. I found it simple to save an item to favorites and add a bookmark. Navigating the broker-platform-like layout was smooth as well. Stock Rover is primarily a desktop and web-based platform and doesn't currently offer a dedicated stock screener mobile app.
Stock Rover has four subscription tiers: Premium, Premium Plus, Ultimate, and Ultimate Pro. Monthly prices run from $34 to $199, and both annual and two-year billing lower the monthly rate. Any plan can be tried free for 14 days. Screener limits run from 15 on Premium up to 300 on Ultimate Pro. Stock Rover is best suited for those who demand more than what their broker can offer, aren’t willing to change brokers, and are willing to pay a premium for better analysis and market tools.
- Pros: Extensive selection of tools and variables to conduct analysis and research. Numerical color-coded scores make it easy to assess rankings and sentiment. The fully loaded version brings more than 800 financial metrics and greater access to additional data limits.
- Cons: Stock and ETF screening is not included on the entry-level Premium plan. It requires Premium Plus, which is $70 a month. Trading directly from Stock Rover is not supported, so it must complement the trading platform available from your online broker.
Free version includes: Basic screening functionality with a limited set of financial metrics, portfolio tracking, watchlists, default screen templates, and access to some charting and research tools. Users can run screens using a subset of available filters, but most deeper metrics and scoring systems are excluded.
Cost
Stock Rover has monthly, yearly, and two-year subscription plans. Pricing information is below:
| Plan | Price (Monthly) | Price (Yearly) | Price (Two-year plan) |
|---|---|---|---|
| Premium | $34/month | $348/year | $576/2 yr |
| Premium Plus | $70/month | $588/year | $1,008/2 yr |
| Ultimate | $99/month | $948/year | $1,656/2 yr |
| Ultimate Pro | $199/month | $1,788/year | $3,096/2 yr |

For a full rundown on all of its features and pricing, check out our complete Stock Rover review.
4. Finviz - Best for day trading scanners
The Finviz stock screener ranks fourth on my list of top screeners because of its large selection of criteria, user-friendly interface, and overall functionality. It’s also a popular stock scanner for day trading, thanks to its fast filtering, visual heatmaps, and ability to quickly identify momentum or breakout candidates. My favorite feature is the ability to hover the cursor over any stock ticker and instantly get a high quality chart thumbnail. These features make Finviz a useful scanner for traders looking for short-term opportunities or day trading setups.
- Pros: Large selection of fundamental and technical criteria. A logical layout makes it easy to use. Quick hover stock charts.
- Cons: The free website version is dominated by ads and there’s no dedicated mobile screener app, which can be limiting for traders who prefer a stock screener app experience. Advanced features like data exporting, customized filters, and backtesting are locked behind FINVIZ Elite paywall (which features two subscription options: Monthly ($39.50/month) and Annual ($299.50).
Free version includes: Access to delayed stock screeners with over 60 filter criteria, including fundamentals (like P/E, EPS growth, ROE), technical filters (such as RSI, pattern recognition), heatmaps, hover-to-view mini charts, insider trading data, and limited news headlines.
Cost
Though there is a free version, much of the best, most advanced features can only be accessed with Finviz*Elite, which is a paid subscription plan. Current pricing is detailed below:
| Plan | Price (Monthly) | Price (Yearly) |
|---|---|---|
| Finviz*Elite Monthly Subscription | $39.50/month | $474.00/year |
| Finviz*Elite Annual Subscription | $24.96/month | $299.50/year |
For a full rundown on all of its features and pricing, check out our complete Finviz review.

Finviz’s free stock screener provides over 60 fundamental and technical filters, making it easy to spot opportunities quickly.
5. Seeking Alpha - Best independent ratings
| Company | Overall | Free version | Monthly Pricing |
 Seeking Alpha Seeking Alpha
|
|
Yes | N/A |
Seeking Alpha offers a wide variety of data and services, and its screeners are useful, but they now come only with the paid membership. The first month is $4.95, which renews at $299/year. That’s a steep commitment if you only want a stock or ETF screener. Seeking Alpha also offers a mobile app, though the stock screener tools are more limited on mobile compared with the desktop experience.
The Seeking Alpha screener’s strength is in its stock ratings and preset screens. You can screen for quantitative ratings, Wall Street analyst consensus, and Seeking Alpha contributors’ opinions. I like having the contributor ratings, because they come from a sophisticated group of market watchers who aren’t beholden to Wall Street.
I found the stock screener to be far more focused on stock fundamentals than price action, which could lead traders to look elsewhere. I also, frankly, think the user interface is clunky. Creating custom screens took way too many clicks compared to other screeners, primarily because I needed to click a button to get to the filtering choices instead of having them always accessible at the top of the page.
- Pros: Seeking Alpha has excellent preset screens and the contributor ratings are unique.
- Cons: The workflow to create custom screens is annoying and there are only a few chart/price action filters.
Free version includes: Access to a basic screener with limited filters, summary-level stock ratings, select financial ratios, Wall Street analyst summaries, and a small sample of editorial content. The free tier does not allow access to the full Quant Rating breakdown or contributor commentary.
Cost
Seeking Alpha has three plans: a free "Basic" plan and two paid plans, Premium and Pro. Pricing information is below:
| Plan | Price (Yearly) |
|---|---|
| Basic | Free |
| Premium | $299.00/year |
| Pro | $2,400.00/year |

For a full rundown on all of its features and pricing, check out our complete Seeking Alpha review.
Other free stock screeners I tested
6. Yahoo Finance - Simple, free screener app
The Yahoo Finance stock screener is basic, but what it lacks in depth of technical and fundamental criteria it makes up for in simplicity. It's also one of the easiest tools to access from a stock screener app, since Yahoo Finance has a well-designed mobile experience that many beginner investors already use. The paid tiers are Bronze, Silver, and Gold. The premium screeners come with Gold, at $49.95 a month. For investors who want a free stock screener app without learning a complex platform, Yahoo Finance remains one of the simplest options available.
Alongside ease of use, the free stock screener includes free streaming quotes, ESG data filters, and results provide useful fundamental data.
Gold adds four screeners: the Smart Money Screener, Top Holdings Screener, Analyst Ratings Screener, and Technical Events Screener. Gold subscribers also get the AlphaSpace platform, 50+ technical chart patterns, and exportable chart data tables.
- Pros: Yahoo's screener is easy to use and includes streaming quotes and ESG filters. It's a simple option for investors who want to learn stock trading.
- Cons: There aren't many criteria available for screening, and many of the best features are locked behind a paywall. The Yahoo Finance app ships with an assortment of predefined screeners, but the filters are not as fully featured as the web app.
Free version includes: Access to the stock screener with basic filters, including market cap, sector, P/E ratio, dividend yield, and beta. Also includes streaming U.S. quotes, ESG score filtering, basic fundamental data views, and support for saved screens within a Yahoo account.
Cost
Yahoo Finance has three paid tiers. Bronze is $9.95/month and covers portfolio tracking. Silver is $24.95/month and adds Morningstar stock ratings, research reports, and expert stock picks. Gold is $49.95/month and includes the premium screeners, the AlphaSpace platform, and up to 40 years of downloadable financial statements. Paying annually gets you 20% off any of the plans, which works out to $95.40 a year for Bronze, $239.40 for Silver, and $479.40 for Gold. Gold comes with a 7-day free trial.
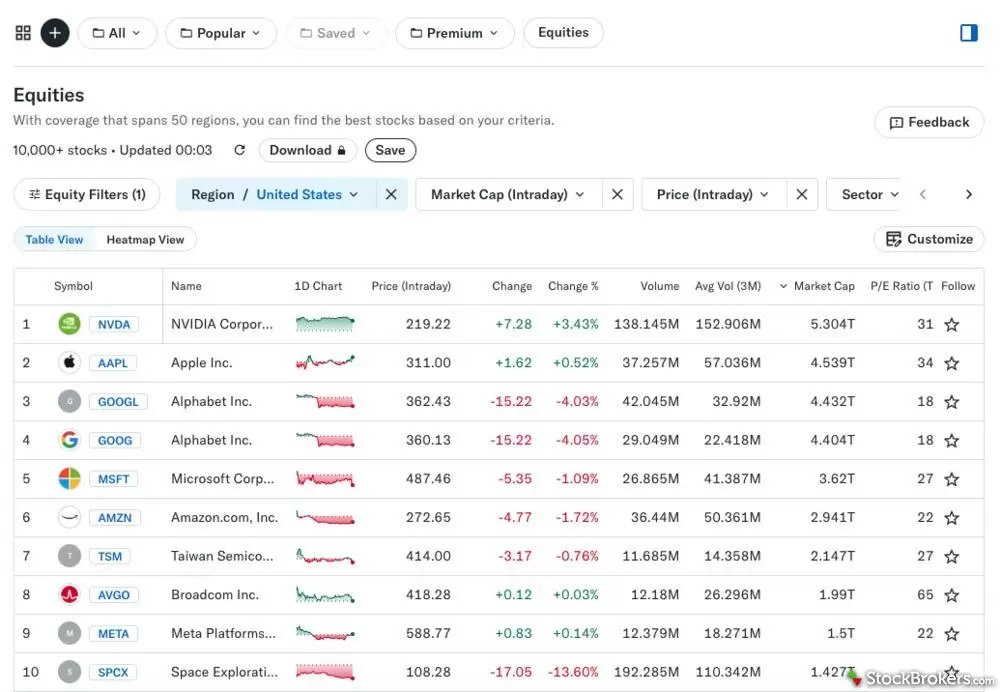
Using Yahoo Finance's free stock screener, users can screen for popular equities using dozens of filters.
Stock screener reviews
Read our Seeking Alpha review covering stock ratings, screeners, portfolio tools, pricing, pros and cons, and how it compares for different investors.
David Rodeck August 26, 2026
Read our Stock Rover review and learn how its advanced screeners, portfolio insights, and research tools stack up for serious, data-driven investors.
David Rodeck September 14, 2026
Read our Finviz review and see how it delivers advanced filtering, interactive heat maps, and in-depth financial visualizations.
David Rodeck August 25, 2026
TradingView has a free plan plus paid tiers from $14.95/mo. Our hands-on review covers pricing, charting, screeners, and whether TradingView is worth it in 2026.
David Rodeck August 19, 2026Related guides
TradingView, StockCharts, and Yahoo Finance offer the best free stock charts. Compare features, fees, and free vs. paid tiers for the top 5 tools of 2026.
Blain Reinkensmeyer June 04, 2026
We tested the best trading journals of 2026. See why Tradervue tops our list, plus top picks for free journals, mobile apps, and every asset class.
David Rodeck August 25, 2026
Compare the best AI trading platforms, apps, and bots for 2026. We tested Trade Ideas, TrendSpider, and more to find the top AI stock trading tools for every type of investor.
Steven Hatzakis August 12, 2026
Download a free trading journal spreadsheet in Excel or Google Sheets to track profits, losses, and lessons learned. Build better trading habits today.
Blain Reinkensmeyer August 25, 2026More guides
Find the best rollover IRA accounts. Compare Fidelity, Schwab, and E*TRADE for easy transfers, low fees, and smart retirement investing tools.
Andrea Coombes May 15, 2026
Practice investing risk-free with the best paper trading platforms. Compare Webull, Schwab, Interactive Brokers, E*TRADE, and more.
Jessica Inskip July 24, 2026
Find the best brokerage for high-net-worth investors. Compare Fidelity, Schwab, Merrill, and more for premium services and tailored investment tools.
Jessica Inskip January 27, 2026
Find the best penny stock brokers. Compare Fidelity, Firstrade, Schwab, E*TRADE, and TradeStation for OTC access, fees, and tools.
Jessica Inskip August 02, 2026
Start investing with ease. Explore the best beginner-friendly trading platforms with low fees, great education, and intuitive apps.
Jessica Inskip August 06, 2026
Find top U.S. forex brokers. From tastyfx to OANDA, explore platforms with strong regulation, great tools, and user-friendly trading.
Steven Hatzakis May 29, 2026
Explore the best international brokers for U.S. investors. Compare Interactive Brokers, Charles Schwab, and Fidelity for global stock trading access.
Jessica Inskip May 22, 2026
Discover the best brokers for trade execution. Compare Fidelity, Interactive Brokers, and more for price improvement, speed, and transparency.
Jessica Inskip May 22, 2026
Find the best crypto trading platform for 2026. We rank eToro, Fidelity, Interactive Brokers, Webull, and Robinhood on fees, security, and coin selection.
Steven Hatzakis May 27, 2026
Find the best Roth IRA accounts. Fidelity, Schwab, and E*TRADE lead with low fees, smart investing tools, and retirement planning support.
Andrea Coombes April 27, 2026
Discover the best day trading platforms. Compare IBKR, Schwab, Fidelity, E*TRADE, and TradeStation for speed, tools, and margin rates.
Jessica Inskip August 03, 2026
We tested the best options trading platforms for 2026. Compare tastytrade, Fidelity, IBKR, E*TRADE & Schwab on tools, fees, and picks for beginners.
Jessica Inskip September 09, 2026
Find the top bank brokerages. From Merrill Edge to Ally, discover brokers that combine banking, investing, and rewards in one account.
Jessica Inskip April 16, 2026
Interactive Brokers and Fidelity lead our 2026 ranking of the best free stock trading platforms, tested on the true cost of $0 commissions and hidden fees.
Jessica Inskip September 02, 2026
Find the best IRA accounts. Compare Fidelity, Schwab, Merrill Edge, E*TRADE, & J.P. Morgan for retirement planning, fees, tools, and account flexibility.
Jessica Inskip March 31, 2026
Discover the best stock brokers of 2026. Compare Schwab, Fidelity, Interactive Brokers, E*TRADE, and more to find the top trading platform for your needs.
Jessica Inskip August 06, 2026
We tested the 5 best futures trading platforms of 2026. Compare commissions, margin rates, and tools for beginners and active traders. Find the right platform for you.
Jessica Inskip July 31, 2026About the Editorial Team
Blain Reinkensmeyer has more than 25 years of trading experience with over 2,500 trades placed during that time. He heads research for all U.S.-based brokerages on StockBrokers.com and is respected by executives as the leading expert covering the online broker industry. Blain’s insights have been featured in the New York Times, Wall Street Journal, Forbes, and the Chicago Tribune, among other media outlets.
Hannah Smith is a Staff Editor at StockBrokers.com. With a background in SEO and years of experience in digital media, Hannah is focused on creating high-quality, data-driven content that helps investors make informed decisions. With a master's degree in English from North Carolina State University, she brings a strong foundation in writing, research, and editorial strategy to her work.
Steven Hatzakis is the Global Director of Research for ForexBrokers.com. Steven previously served as an Editor for Finance Magnates, where he authored over 1,000 published articles about the online finance industry. Steven is an active fintech and crypto industry researcher and advises blockchain companies at the board level. Over the past 20 years, Steven has held numerous positions within the international forex markets, from writing to consulting to serving as a registered commodity futures representative.