TipRanks is an investment research platform that turns complex data into easy-to-understand stock insights. By using AI and big data, it compiles analyst ratings, insider trades, news sentiment, and more into simple scores that help investors quickly evaluate potential trades.
While the analysis isn’t as in-depth as what you’d find on platforms like Stock Rover or Morningstar, TipRanks excels at idea generation. It’s a solid choice for investors who want to follow the “smart money” without doing all the heavy lifting—assuming you’re comfortable trusting its algorithms.
TipRanks pros and cons
thumb_up_off_alt Pros
- Combines analyst ratings, insider trades, and AI insights
- Smart Score helps quickly spot top-rated stocks
- Easy to use, even for beginners
- Compare your portfolio to other investors
thumb_down_off_alt Cons
- Smart Score is a black box
- Tools lack depth for advanced research
- Feels a bit gamified
- Expensive, with yearly billing only
Overall summary
|
Feature |
 TipRanks TipRanks
|
|
Overall
info
|

|
|
Features
info
|

|
|
Ease of Use
info
|

|
|
Cost
info
|

|
|
Free version
info
|
Yes
|
|
Monthly Pricing
info
|
N/A
|
|
Annual Pricing
info
|
$360/yr
|
Cost and plans
TipRanks offers three account tiers: Free, Premium, and Ultimate. You must commit to a full-year subscription for either paid plan, with no monthly option. Premium is priced at $360 per year, and Ultimate runs $600 per year.
While it doesn’t offer a month-by-month option, TipRanks offers a 30-day money-back guarantee, giving you time to test the platform. When I reviewed the service in September 2025, TipRanks was offering a 55% discount for new users, which brought the entry price down significantly.
Free version
TipRanks’ free version is surprisingly open; you don’t need to sign up or enter an email to test drive the basic tools. You can use screeners, explore charting, and run portfolio analysis tools straight from the homepage. If you do register with an email, you can save portfolios, watchlists, and track performance over time.
That said, the free version limits access to what makes TipRanks valuable. Most of the key data, Smart Scores, analyst ratings, price targets, and top expert picks, are locked behind a paywall. You’ll see blurred-out data with a lock icon, making it obvious what you’re missing. There are also occasional pop-up ads, though I didn’t find them too distracting.
The free version is a decent preview tool, but it doesn’t offer much that you couldn’t already get from Yahoo Finance or other free platforms. If you’re serious about using TipRanks for portfolio research, you’ll need to upgrade.
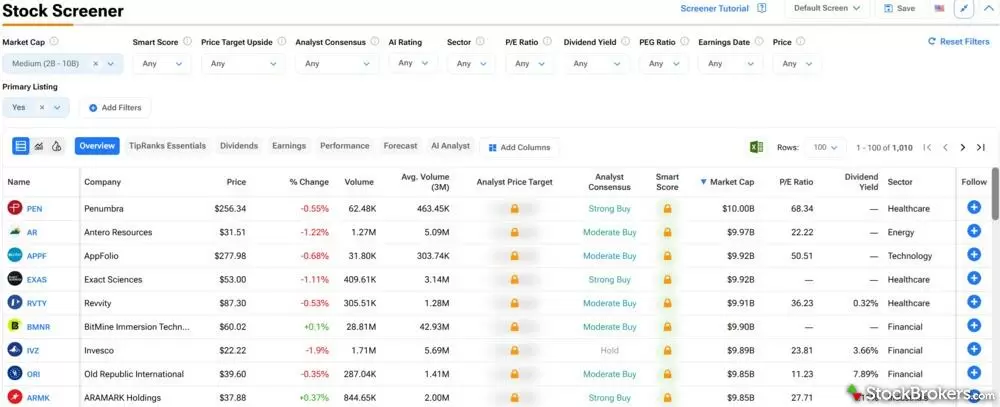
You can access some of TipRanks' screener in its Free version, but certain features like price target and Smart Score will be locked.
Premium
TipRanks Premium gives you access to most of the platform’s core features. You can view the Smart Score for any stock, which is a 1 to 10 rating that combines analyst sentiment, fundamentals, insider activity, and more. You get far more data about every stock and other investment, including Analyst Price Forecasts and insider trading activity.
One feature I found especially useful was seeing the average price target on stocks in my portfolio. This helped me quickly gauge which companies professionals believed were worth buying and which were not at their current market prices. You can also see lists of top investment picks by analysts, financial bloggers, and hedge funds. You can skim this data yourself and will receive a daily recap with relevant information.
Premium covers what most investors will need. It simplifies the research process and pulls together hard-to-find data into one dashboard. If you want to track smart money and follow professional sentiment, Premium is more than enough.
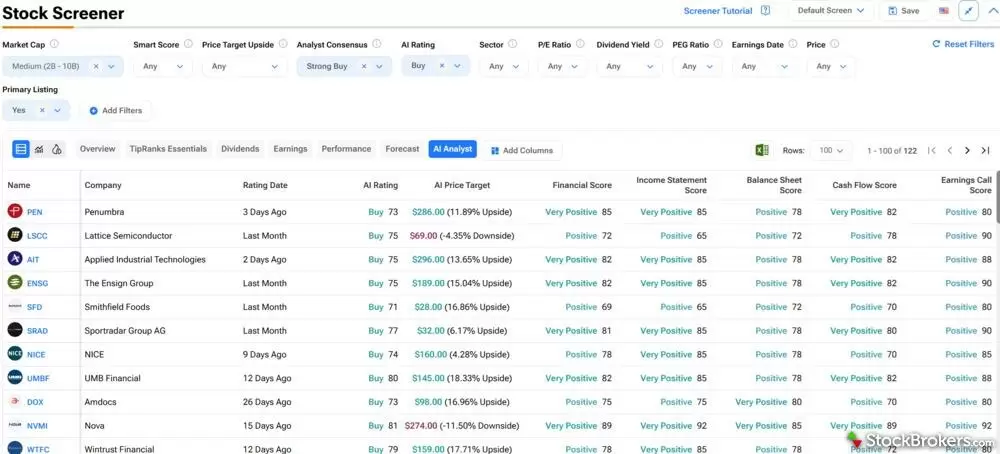
With a Premium or Ultimate subscription to TipRanks you can access more features in its stock screener like price targets and Smart Scores.
Ultimate
TipRanks Ultimate takes things further, adding more expert sources, advanced performance analytics, and AI-powered risk analysis. You can analyze expert stock pick performance over a range of timeframes, going from two weeks to two years, so you can see how they performed over your target, versus just one year on Premium.
One standout feature in Ultimate that I found fascinating was the risk analysis. TipRanks' AI tool analyzes financial data to identify specific risks that investors may face. For example, during my review, one stock I was considering had a substantial risk of not having sufficient capital on hand to complete a major future project, which could create a price shock if this were to happen. TipRanks highlighted this stock for me. While I could’ve dug through financial statements to find this, it was nice to have it summarized so quickly and easily.
Ultimate doesn’t dramatically change the interface, but the additional data may be valuable for investors who want deeper insights before making a move. If these tools help you avoid a bad trade or make one solid decision, it could easily justify the higher price tag.
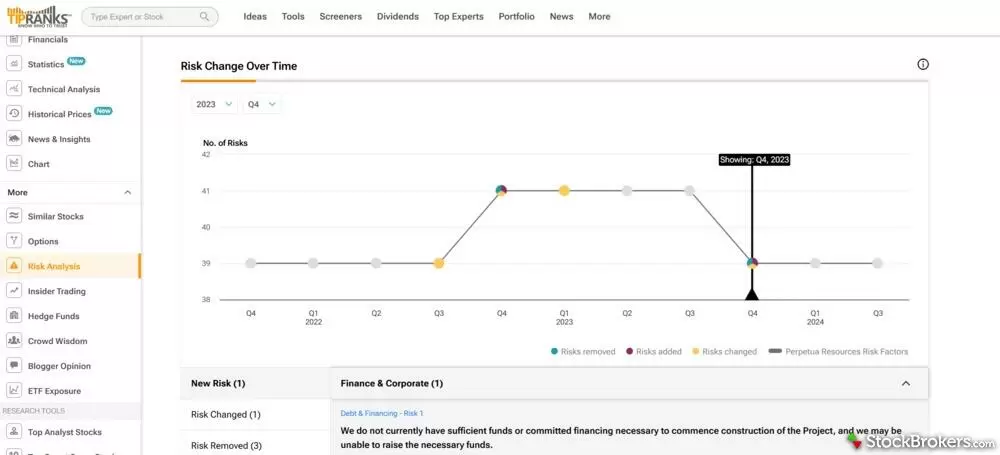
TipRanks' AI tool analyzes financial data to determine risk factors when trading, flagging them for investors.
Features
TipRanks is primarily a market research tool that utilizes AI and big data to help investors identify new trades for their portfolios. They do so with several tools, combining the insights of industry experts and publicly available investment data. Here’s a breakdown of the key features.
Investment research
TipRanks covers a wide range of assets, including stocks, ETFs, crypto, commodities, and options. Search for any investment you’re interested in, and you’ll see everything from financial reports and market news to price trends. From there, it expands into more detailed information, including a technical analysis of past performance, analyst forecasts about future price targets, and even an AI report summarizing the pros and cons of each stock.
One standout tool is the Smart Score, which ranks investments on a scale of 0 to 10, indicating the quality of a potential investment. According to TipRanks, stocks with a score of 10 have returned nearly 390% since 2016, compared with about 225% from the S&P 500.
The presentation is polished and approachable, but it risks oversimplifying. For example, between the Smart Scores and the analyst price targets, it made it seem like predicting investment returns was more guaranteed than it really is. A high Smart Score and a bullish analyst price target don’t guarantee future returns. It’s useful guidance, but I’d recommend treating these predictions as inputs to your research, not final answers.
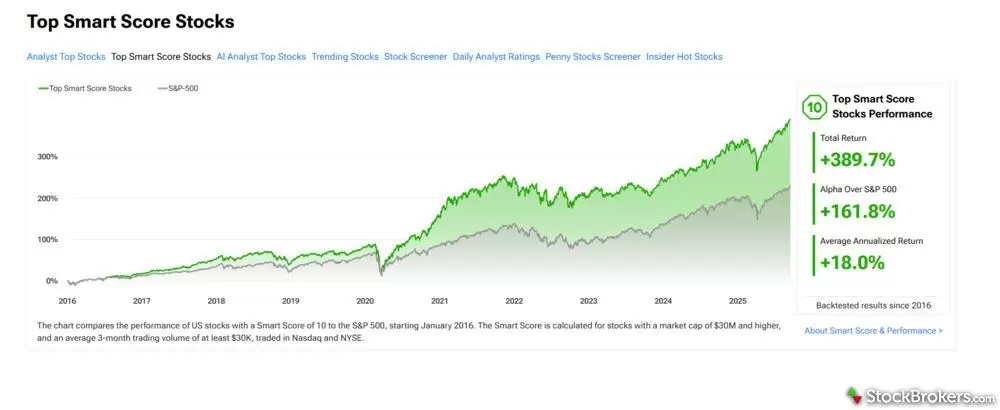
TipRanks' Smart Score uses a scale between 0 to 10 to indicate the quality of an investment.
Screeners and investment ideas
TipRanks provides lists of potential investment ideas, such as the top Analyst picks, those with the highest Smart Score, and ETFs with the most upside. The platform also offers screeners to help you sort through and identify investments based on your target criteria, such as industry, market capitalization, and financials.
The screener itself is straightforward. You can filter by industry, market cap, or financials, and I liked that it even included penny stock options.
Still, I found the screeners to be basic compared to platforms like Finviz or Stock Rover. I couldn’t really get into granular financial data. The screener felt more like TipRanks guiding me to their top picks, based on the Smart Score and Analyst ratings, rather than letting me find opportunities on my own. That’s fine for beginners, but experienced investors may find it restrictive.
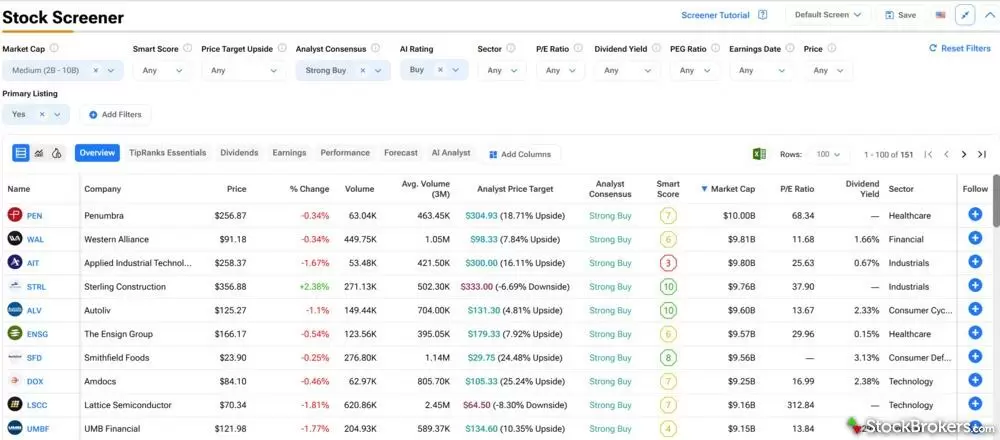
TipRanks' stock screener is straightforward and offers filters for your investments based on your target criteria, such as industry, market capitalization, and financials.
Portfolio analysis and watchlists
Once you’ve identified some investments with potential, you can add them to your TipRanks portfolio for analysis and tracking. You could also sync your broker and existing portfolio directly to TipRanks. The platform summarizes your returns, performance, and market news for these investments.
I liked how clear the analysis was presented and got a few takeaways of information. For example, I appreciated how it summarized my risk level and performance in comparison to other investors on the platform. That said, the analysis is surface-level. The Smart Score again does most of the heavy lifting.
Watchlists and alerts are easy to set up, but customization is limited. Unlike TradingView, which offers hundreds of alert conditions, TipRanks only supports a handful.
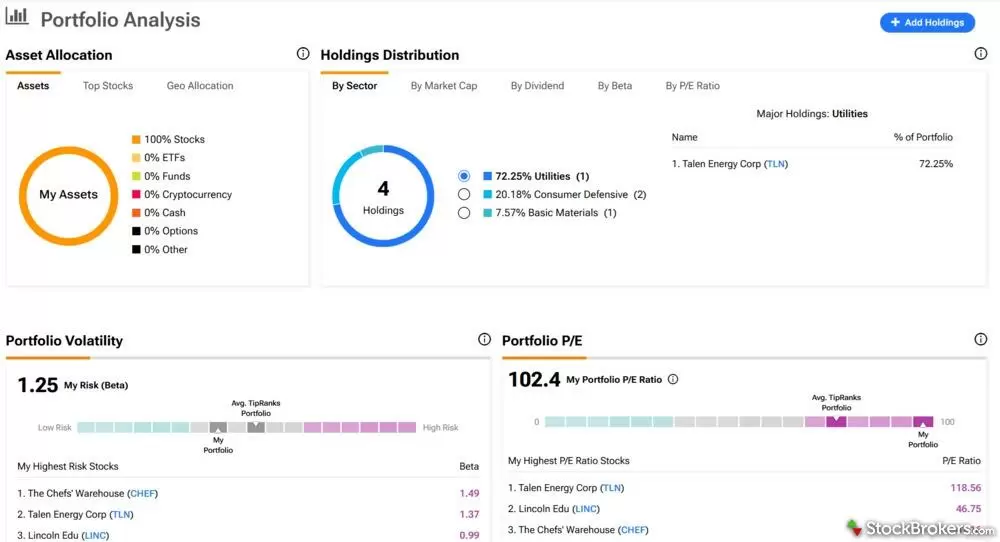
TipRanks conducts a portfolio analysis for you, showing you your returns, performance, and market news for your investments.
Newsletters
TipRanks sells four different weekly newsletters, covering growth stocks, value stocks, dividend stocks, and long-term investing. Subscriptions cost between $200 and $300 per year in addition to your TipRanks plan, with possible discounts depending on when you sign up.
Calculators, calendars, and charting
Beyond its main research tools, TipRanks offers a few extras. The charting tool is basic but functional. It felt like an afterthought and was hidden on the website. That said, TipRanks can run a basic technical analysis for you, which is convenient for investors less familiar with charting.
You’ll also find calculators like dividend rate estimators and earnings calendars. One addition I came across was a Trump news tracker, which analyzed how his social media activity moved certain stocks. While gimmicky, it shows how TipRanks tries to make market data engaging.
These tools aren’t advanced enough to replace standalone charting or research software, but they’re a nice supplement for casual investors.
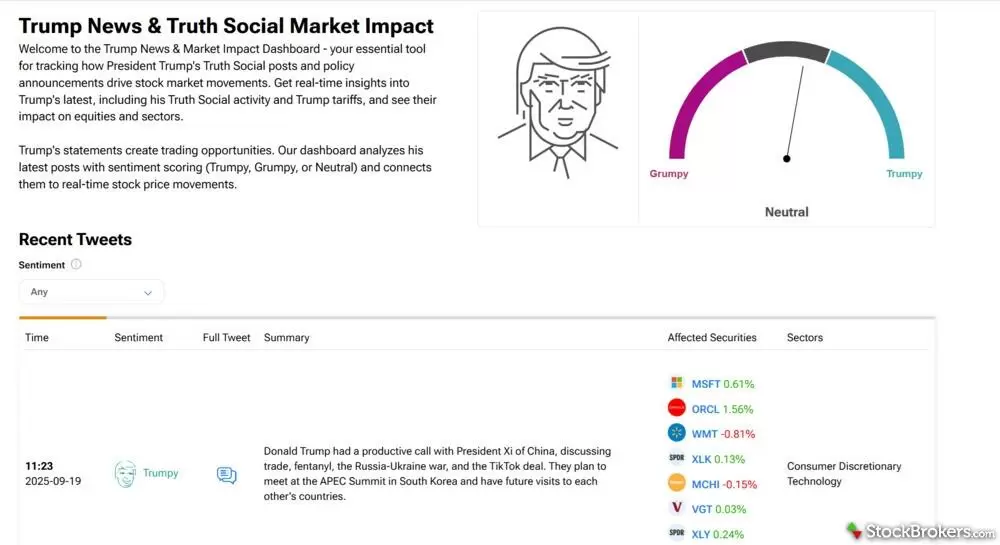
TipRanks draws from social news to alert of potential impacts to trading and investments.
Social investing and portfolio comparisons
TipRanks adds a social layer by letting you compare portfolios with other users, which can be fun and motivating. You can follow top-performing investors, track the moves of professionals, and even share your own portfolio publicly. The platform also shows how your returns stack up against the average TipRanks user.
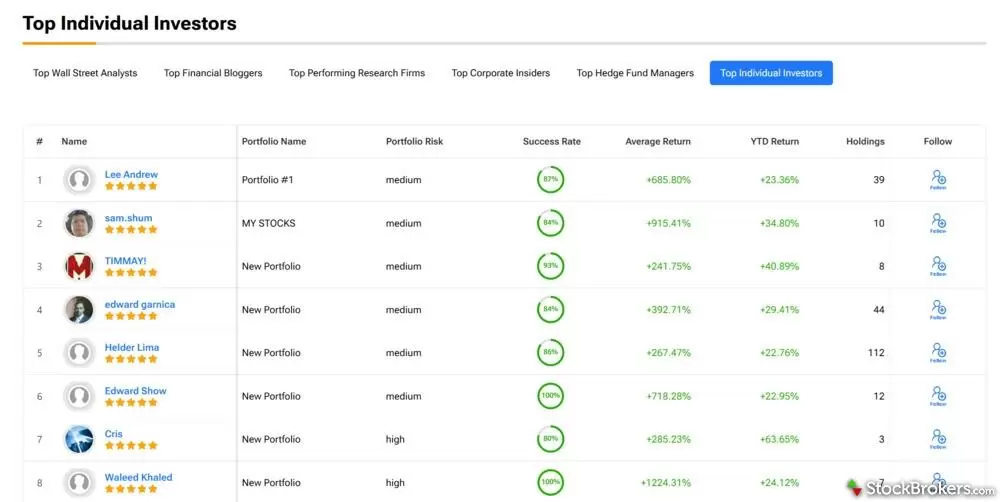
TipRanks allows you to follow top-performing investors, track the moves of professionals, and even share your own portfolio to compare your investments to the average TipRanks user.
Ease of use
TipRanks is one of the easier research platforms I’ve tested. The layout is clean, the visuals are engaging, and the color scheme makes it instantly clear which investments are viewed positively or negatively. Despite the volume of information available, I found it simple to navigate without feeling overwhelmed.
When I did need extra guidance, TipRanks made it easy. Each tool has built-in resources and explanations, so I rarely felt stuck. Customer support is available by email and phone, with faster response times for Premium and Ultimate members. Free users may wait longer, but support is still accessible.
The one thing missing is a chatbot or quick-answer tool for basic questions. Even so, the site is well designed, so I never felt stranded. Overall, it’s a user-friendly experience that keeps research approachable.
Final thoughts
Is TipRanks Worth It?
TipRanks is a solid option if you want straightforward investment recommendations powered by AI and big data. The platform is easy to use, visually engaging, and gives clear signals about which which investments may have potential. The platform’s value really comes down to how much you trust its Smart Score system and aggregated insights.
That said, TipRanks won’t suit everyone. If you prefer detailed, human-written research reports, you’ll likely find more value in Morningstar or Seeking Alpha. And if you’re a hands-on investor who likes to dig into financials yourself, TipRanks may feel light compared to advanced platforms with customizable tools.
Alternatives to TipRanks
If TipRanks doesn’t feel like the right fit, there are several strong alternatives. Morningstar and Seeking Alpha both emphasize human-driven research and in-depth reports, making them better choices for investors who want context and expert commentary.
For DIY investors, Finviz offers a more powerful screener with hundreds of metrics, while TradingView excels at charting and customizable alerts. Both give you far more control over how you analyze markets.
StockBrokers.com Review Methodology
Why you should trust us
David Rodeck, a contributing writer for StockBrokers.com, has over a decade of writing experience specializing in investing, trading, and retirement planning. Before becoming a full-time writer, David was a financial advisor and passed the Series 6 and CFP exams. He has written for AARP, Kiplinger Magazine, Forbes Advisor, and Investopedia.
Blain Reinkensmeyer, co-founder of StockBrokers.com, has been investing and trading for over 25 years. After having placed over 2,000 trades in his late teens and early 20s, he became one of the first in digital media to review online brokerages. Today, Blain is widely respected as a leading expert on finance and investing, specifically the U.S. online brokerage industry. Blain has been quoted in The New York Times, The Wall Street Journal, Forbes, and Fast Company, among others. Blain created the original scoring rubrics for StockBrokers.com and oversees all testing and rating methodologies.
How we tested
- We used paid trading tool accounts for testing.
- We collected dozens of data points across the tools we review.
- We tested each tool’s website, desktop platforms, and mobile app, where applicable.
- We maintained strict editorial independence; trading tools cannot pay for a higher rating.
Our researchers thoroughly test a wide range of popular trading tools' features, such as trading journals and screeners, charting providers, and educational resources. We also evaluate the overall design of each tool’s mobile experience and look for a fluid user experience moving between mobile and desktop tools.
At StockBrokers.com, our reviewers use a variety of devices to evaluate trading tools. Our reviews and data collection are conducted using the following devices: iPhone SE running iOS 17.5.1, MacBook Pro M1 with 8 GB RAM running the current MacOS, and a Dell Vostro 5402 laptop i5 with 8 GB RAM running Windows 11 Pro.
Each trading tool was evaluated and scored across three key categories: Ease of Use, Features, and Cost. Learn more about how we test.
Trading tools tested in 2026
We tested 9 trading tools and service providers for stock traders in 2026:

 TipRanks


