Stock Rover is a high-powered investment screener with portfolio analysis tools. While basic screeners are widely available, Stock Rover stands out for offering over 700 different metrics, enabling investors to dive far deeper in sorting trade opportunities, all at a competitive price.
That said, the Stock Rover platform can feel intimidating, especially for beginner investors who may not understand more sophisticated financial terms. Our Stock Rover review explores the platform’s features, pricing, and how it stacks up for different types of investors.
Stock Rover pros and cons
thumb_up_off_alt Pros
- Excellent screener; over 700 criteria for filtering thousands of stocks, ETFs, and mutual funds.
- Free version has the basics and just $7.99 per month for an Essentials subscription.
- All paid plans have a 14-day free trial.
- Trade and portfolio analysis tools include charting, dividend income forecasts, and Monte Carlo simulations.
- Stock Rover publishes weekly ideas for screener strategies and stock ratings.
thumb_down_off_alt Cons
- The platform has a learning curve due to all the information, research, and tools.
- Stock Rover’s tools do not include international investment markets or crypto.
- Research reports require you to pay an additional $49.99 to $99.99 a year, depending on your subscription.
Overall summary
|
Feature |
 Stock Rover Stock Rover
|
|
Overall
info
|

|
|
Features
info
|

|
|
Ease of Use
info
|

|
|
Cost
info
|

|
|
Free version
info
|
Yes
|
|
Monthly Pricing
info
|
Starts at $7.99/mo
|
|
Annual Pricing
info
|
Starts at $79.99/yr
|
Cost and plans
Stock Rover costs will depend on your subscription level. The platform offers three paid options, each with a discount if you enroll for a year or two rather than monthly:
| Plan |
Price (Monthly) |
Price (Yearly) |
Price (Two years) |
| Essentials |
$7.99 |
$79.99 |
$139.99 |
| Premium |
$17.99 |
$179.99 |
$319.99 |
| Premium Plus |
$27.99 |
$279.99 |
$479.99 |
Stock Rover also offers a Free plan with limited capabilities. When you first enroll, you get a 14-day free trial period to test out all the plans. There were a couple of features I appreciated about the trial.
First, I didn’t need to provide my credit card information, which made the enrollment process a breeze. All I needed was my name and email. Second, the trial account lets you switch between all four account options, ranging from Free to Premium Plus. That truly let me decide which paid version best fit my needs.
You can also buy Stock Rover Research Reports for an additional fee, providing detailed information on thousands of stocks. It costs $49.99 per year if you have a one-year or two-year Stock Rover subscription, or $99.99 per year with no subscription.
Free plan
Stock Rover’s free plan lets you track the performance of your portfolio. On the dashboard, you can view price charts, market news, and comparisons against the broader market. You can also access more detailed information about specific stocks and funds, including news, financial data, analyst ratings, and performance compared to similar peers.
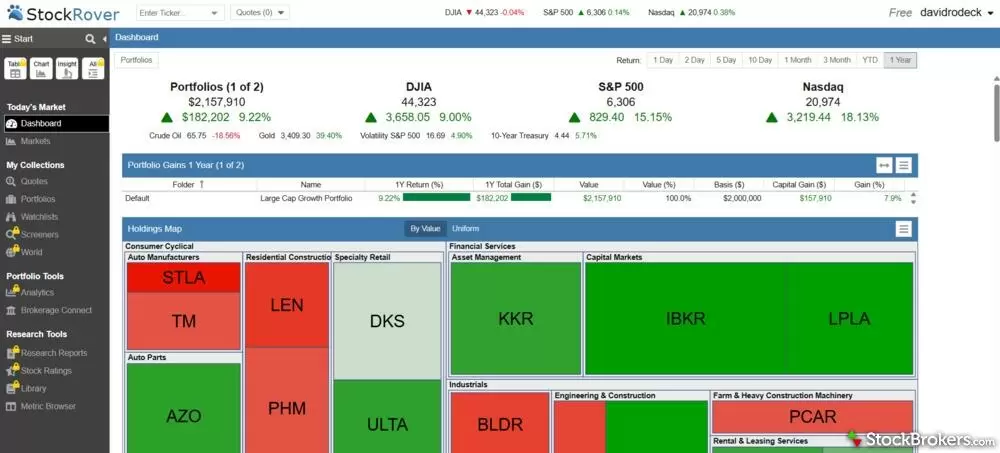
With a free subscription to Stock Rover you can easily view your portfolio to track pricing and the broader market.
With a free account, you have limited access to Stock Rover’s charting tool. Additionally, you can’t use Stock Rover’s screener or other portfolio analysis tools. The free plan also has ads.
If you’re looking to collect ongoing market news and financial data, the free plan could be a nice option, but it doesn’t offer much for hands-on portfolio research.
Essentials
An Essentials subscription opens access to Stock Rover’s screener. This plan includes over 275 metrics that you can use to filter potential investments, such as returns vs. sector, earnings per share (EPS), and trading volume. With an Essentials subscription, you can screen data from the past five years.
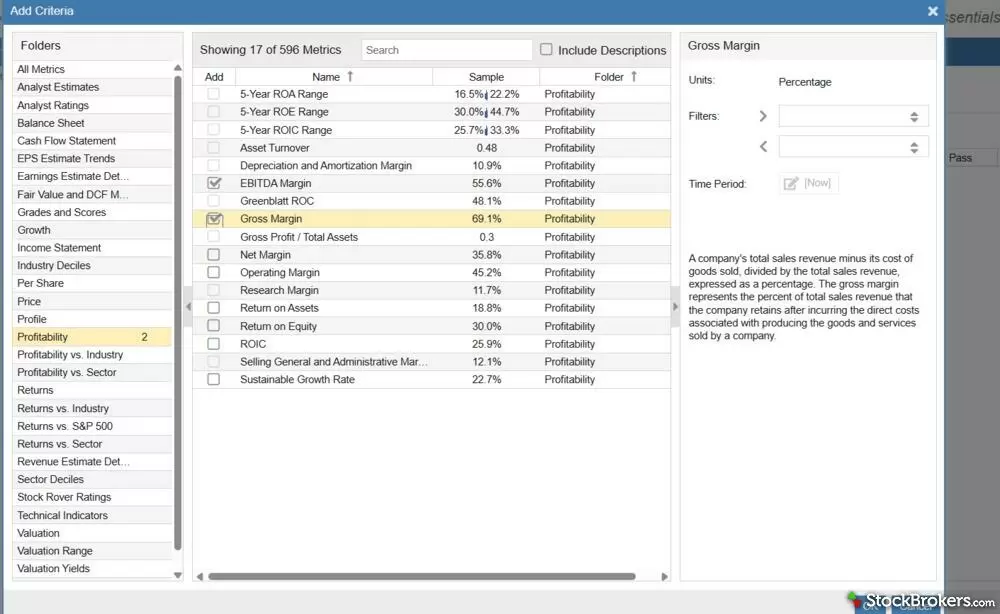
With Stock Rover's Essentials plan you can view metrics like probability and gross margin along with over 275 other metrics.
The Essentials subscription is a nice introduction to Stock Rover, but it felt like a bit of a tease. The majority of the screener criteria are blocked. They appear on the screen, but you can’t click them.
While I understand why Stock Rover does this as a business, it was a little annoying as a user. Still, if you’re looking for a low-cost screener, Essentials handles the fundamentals well.
Premium
With the Premium subscription, you can use an additional 100 filters for the screener, bringing the total to over 375. In addition, you can screen data from the past 10 years.
Besides the screener upgrade, you can access Stock Rover’s portfolio analysis and research tools, including correlation analysis of investments in your portfolio, dividend income predictions, suggestions for portfolio rebalancing, and Monte Carlo Simulations.
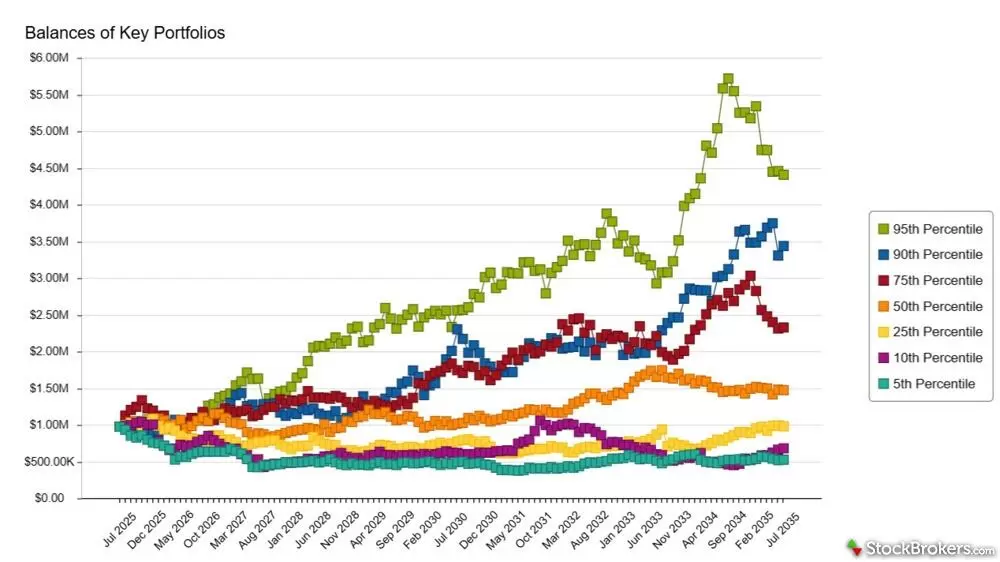
With Stock Rover's Premium plan you can conduct Monte Carlo Simulations to view the probability of different investment outcomes.
I found these tools helpful, especially for a larger portfolio with many investments. For example, the correlation analysis identified several stocks that were highly correlated, meaning their historical prices followed very similar patterns. Two had a score of 0.82 over the past three months, close to the maximum of 1 for perfect correlation. That potentially created unnecessary volatility in my portfolio, which could be mitigated through increased diversification.
Premium Plus
The most expensive Premium Plus plan unlocks all available screeners at Stock Rover, totaling over 700. These criteria bring in more professional advice and feedback. For example, you can screen based on analyst ratings and predictions, such as a minimum number of analysts who give a stock a Strong Buy rating.
With the Premium Plus subscription, you can write in a goal or target equation, and the platform suggests screeners. For example, I started writing in “1 month return versus industry”, and it gave me ideas. I thought this would help if I had a strategy in mind, but I wasn’t quite sure what screener was appropriate.
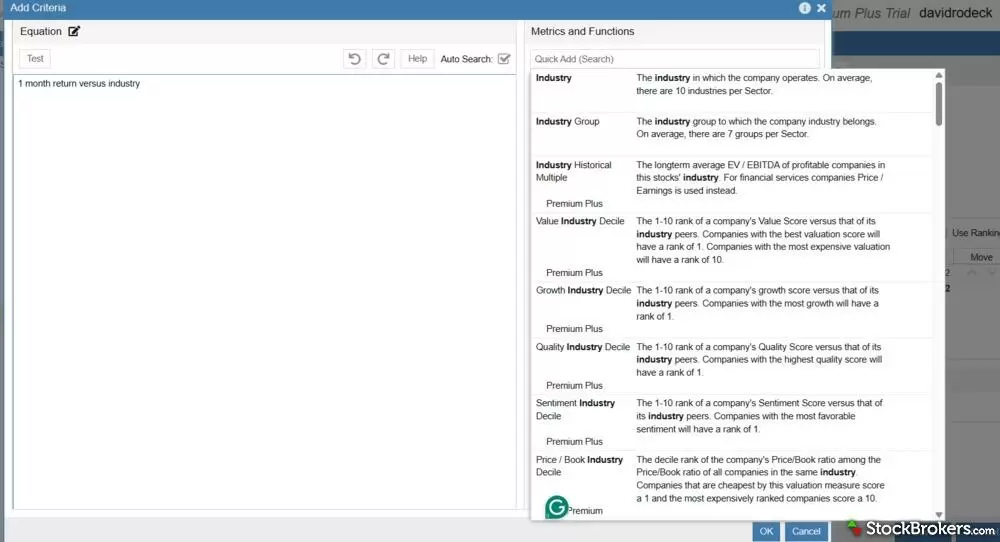
Stock Rover's equation screener let's you enter in an equation and get results on possible investment ideas.
Features
Stock Rover packs a ton of information and investment research tools into its platform. While it’s primarily known for its screener, you also receive many other valuable features depending on your subscription tier.
Screener
Stock Rover’s screener is available for all paid subscriptions. The more expensive the plan, the more criteria you have available.
I was impressed with the sheer volume of possible screeners. I also liked how Stock Rover gave clear definitions for each one, including examples of possible ranges to target, such as 15.1% as a sample target range for a 5-year EPS Growth Estimate.
While I appreciated the volume of financial information, I found the screener a little clunky to use. For example, after creating a list of target investments, I set them up in a table format to view everything. From there, it puzzled me how to return to the screener itself to refine my search. Eventually, I was able to retrace my steps, but the troubleshooting took time.
Portfolio analysis tools
You can sync your broker and existing portfolio directly to Stock Rover for analysis. I found the process quicker and easier than on other platforms; all I had to do was log in to my Robinhood account, and the real-time data was available.
I believe these tools provided valuable insights into my strategy. For example, I liked being able to forecast my future investment income, based on a target portfolio. I can see that coming in handy if I were trying to live off my investments, such as in retirement.
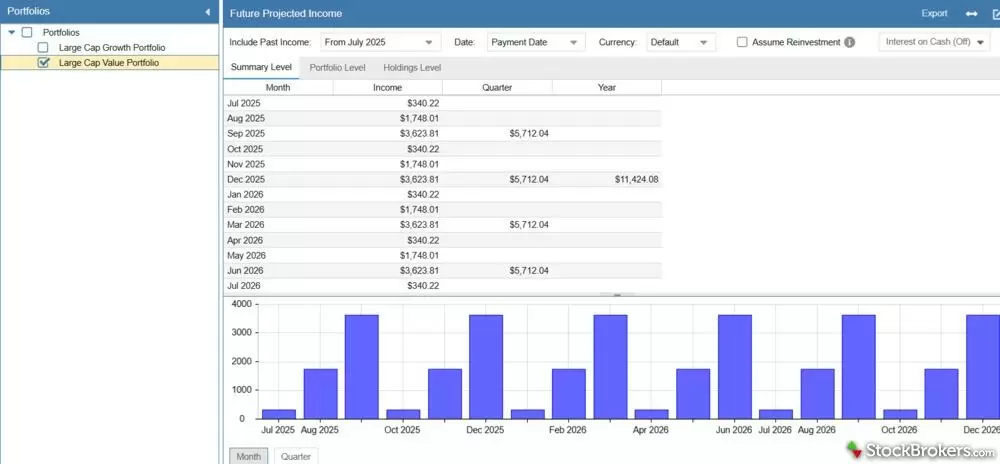
Stock Rover lets you calculate future projected incomes for value and growth.
Watchlists, alerts, and warnings
You can set up investment watchlists on your Stock Rover account, which will track performance, news, ratings, and other information about investments you have an eye on.
On each paid subscription plan you can also receive Investor Warnings about each investment. This feature called my attention to factors I don’t usually consider when buying stocks. For example, one stock I was researching warned me that the Goodwill on the balance sheet was high, possibly from overpaying for recent acquisitions, and this could be a drag on future earnings.
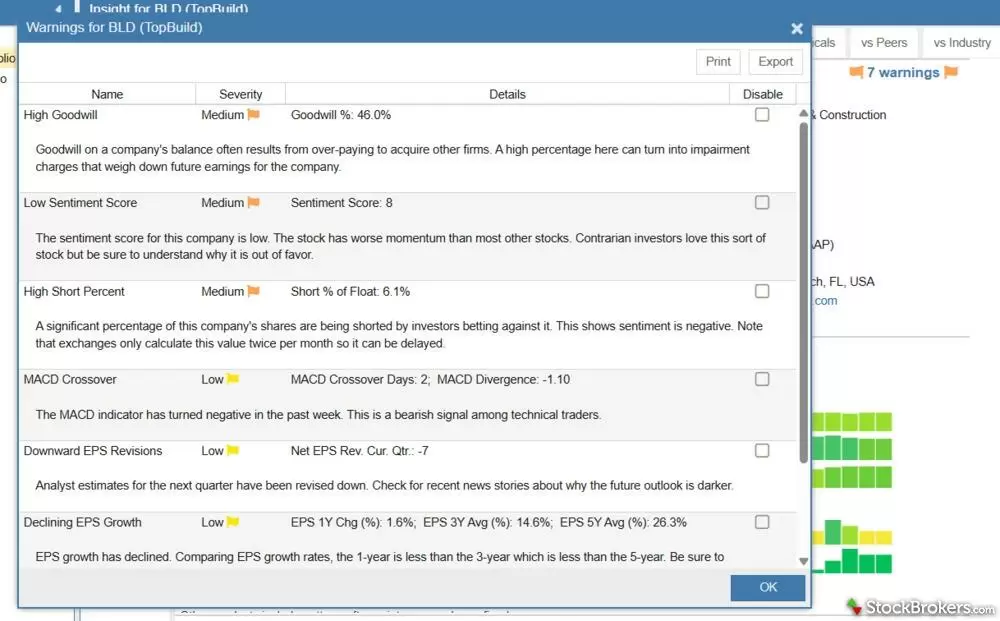
Stock Rover gives you warnings and explanations when an investment is low or high risk.
You can also set up text or email alerts when a target investment meets or falls below a specific criterion, such as a price change, volume, or dividend yield.
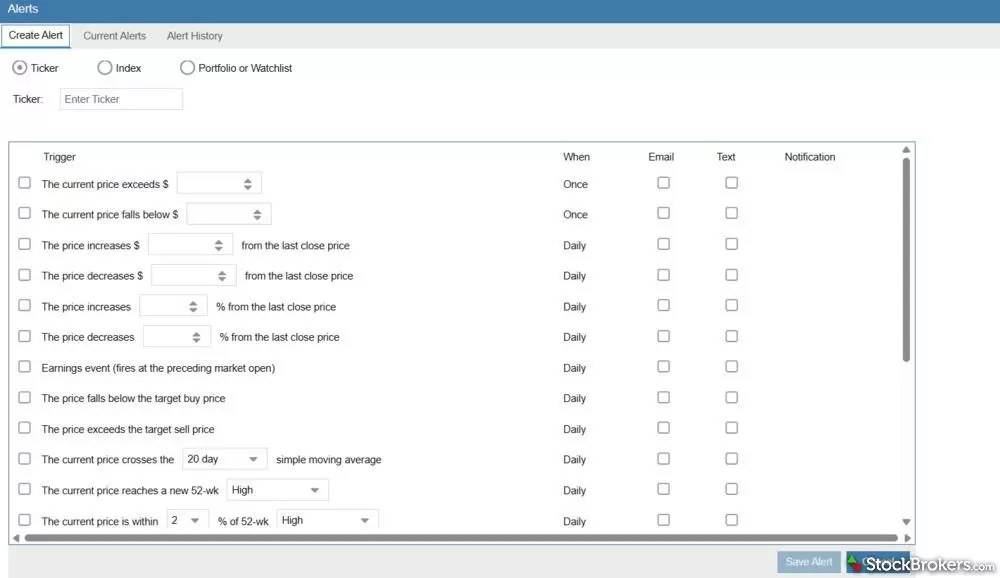
Stock Rover lets you set up email or text alerts for price increases or decreases.
Market news, stock ratings, and research reports
Stock Rover offers a wealth of information to users, including those on the free plan. The dashboard brings up market news and performance, and you can access the financial information for each stock and fund, along with ratings from Stock Rover itself.
I appreciated that Stock Rover provides weekly ideas for investors, including screeners that could be worth using.
For more information, you can pay for the Research Reports. These could be helpful if you’re looking for a deeper dive on your investments, especially since the cost of reports is considerably less than a Morningstar subscription.
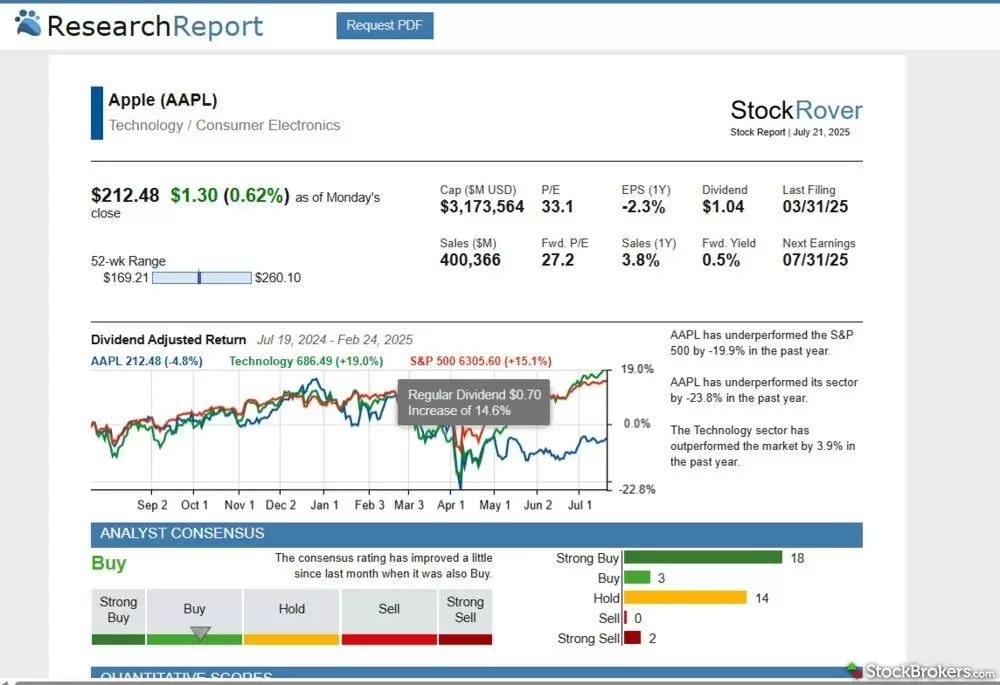
For an additional charge you can receive Stock Rover research reports for your investments.
Charting
Stock Rover also provides charting, including a stripped-down version on the free account. The higher your tier, the more capabilities you can get.
The charts provided some interesting information. For example, I appreciated being able to plot the market price of a stock relative to its earnings per share, a type of fundamental analysis that can indicate whether an investment is under- or overvalued.
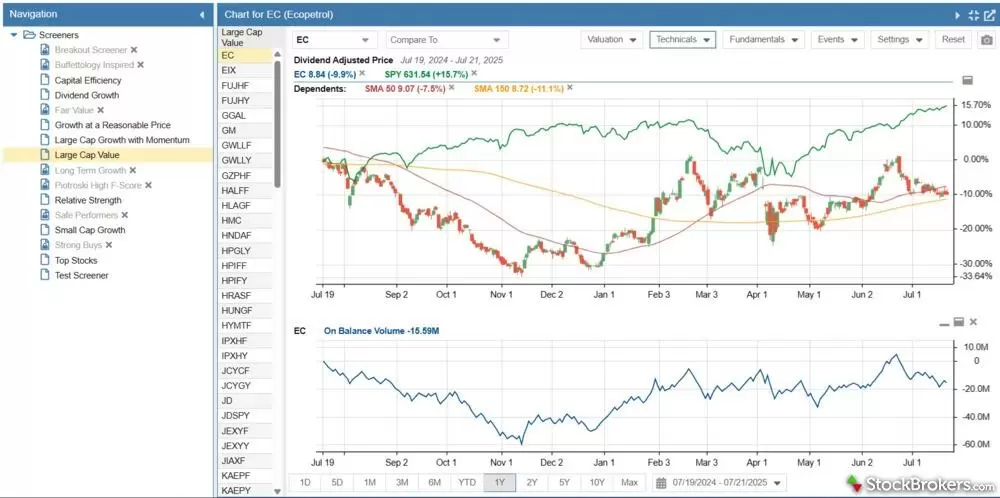
Stock Rover allows you to view cap value, along with other metrics in its charting tool.
That said, the charting tool felt like an afterthought compared to the other tools. It wasn’t as easy to add information or compare multiple investments.
Ease of use
Stock Rover does have a learning curve for new users. There’s a lot of information and different features to sort through, and moving from section to section didn’t always feel intuitive to me.
For example, the screen would get crowded at times with all the different information from the screener tables, charts, insights, and my portfolios. There were multiple times during my Stock Rover review where I felt lost and couldn’t figure out how to retrace my steps.
Stock Rover has taken steps to simplify and improve ease of use over the past year. For example, you can now switch to a simplified view with one click, featuring fewer tabs and items on the screen. That’s a step in the right direction. However, I once accidentally wiped out most of the tool shortcuts on the left side, and it took some time to figure out how to get them back.
While Stock Rover has training videos, it would be nice if it provided more on-screen guidance. Customer support is also limited to emails only unless you are on the yearly or two-year Premium or Premium Plus plans. For an additional $50 per year you can access prioritized hotline telephone support.
Final thoughts
Is Stock Rover worth it?
Stock Rover offers a depth of tools for investors at a very reasonable price. Even its most expensive Premium Plus subscription is still cheaper than many other competitors. Through Stock Rover, you gain access to a first-class screener, as well as portfolio analysis tools, trade ideas, and alerts.
For investors who want to dig into fundamentals, backtest strategies, and analyze portfolios with precision, it’s hard to find this level of power at the Stock Rover cost.
Alternatives to Stock Rover
For an alternative, Finviz is also a powerful screener, and the platform is more visually pleasing and easier to learn. However, it’s more expensive at $39.50 per month. On the other hand, if you just want the basics, Yahoo Finance and TradingView both offer decent screeners for free, though with fewer metrics than Stock Rover.
StockBrokers.com Review Methodology
Why you should trust us
David Rodeck, a contributing writer for StockBrokers.com, has over a decade of writing experience specializing in investing, trading, and retirement planning. Before becoming a full-time writer, David was a financial advisor and passed the Series 6 and CFP exams. He has written for AARP, Kiplinger Magazine, Forbes Advisor, and Investopedia.
Blain Reinkensmeyer, co-founder of StockBrokers.com, has been investing and trading for over 25 years. After having placed over 2,000 trades in his late teens and early 20s, he became one of the first in digital media to review online brokerages. Today, Blain is widely respected as a leading expert on finance and investing, specifically the U.S. online brokerage industry. Blain has been quoted in The New York Times, The Wall Street Journal, Forbes, and Fast Company, among others. Blain created the original scoring rubrics for StockBrokers.com and oversees all testing and rating methodologies.
How we tested
- We used paid trading tool accounts for testing.
- We collected dozens of data points across the tools we review.
- We tested each tool’s website, desktop platforms, and mobile app, where applicable.
- We maintained strict editorial independence; trading tools cannot pay for a higher rating.
Our researchers thoroughly test a wide range of popular trading tools' features, such as trading journals and screeners, charting providers, and educational resources. We also evaluate the overall design of each tool’s mobile experience and look for a fluid user experience moving between mobile and desktop tools.
At StockBrokers.com, our reviewers use a variety of devices to evaluate trading tools. Our reviews and data collection are conducted using the following devices: iPhone SE running iOS 17.5.1, MacBook Pro M1 with 8 GB RAM running the current MacOS, and a Dell Vostro 5402 laptop i5 with 8 GB RAM running Windows 11 Pro.
Each trading tool was evaluated and scored across three key categories: Ease of Use, Features, and Cost. Learn more about how we test.
Trading tools tested in 2026
We tested 9 trading tools and service providers for stock traders in 2026:

 Stock Rover


