 Charles Schwab
 Fidelity
 Interactive Brokers
 E*TRADE
 Webull
 TradeStation
 tastytrade
 eToro
eToro Trading 212
 Interactive Investor
 IG
IG Interactive Brokers
 XTB
XTB Hargreaves Lansdown
 Saxo
Saxo Charles Stanley Direct
 CIBC Investor's Edge
 Interactive Brokers
 Moomoo
 Questrade
 Qtrade
 TD Direct Investing
 Wealthsimple
 Finviz
 Stock Rover
 Seeking Alpha
 StockHero
 TipRanks
 TrendSpider
 Trade Ideas
 TraderSync
 TradingView
 Tradervue
 TradeZella
TradingView Review

Written by David Rodeck
Contributing Writer

Edited by Jeff Anberg
Senior Editor

Fact-checked by Joey Shadeck
Research Analyst
David RodeckContributing Writer
David Rodeck is a financial writer based in New York City. He specializes in making investing, trading, and retirement planning understandable.

TradingView is one of the most popular charting platforms in the world, with over 100 million traders and investors enrolled. With powerful charting tools, screeners, watchlists, and community forums, I can see why it has such widespread appeal.
In addition to all its capabilities, I found TradingView user-friendly and fun to engage with. It's also experimenting with a new AI charting assistant that I found helped me get even more out of my experience than when I first tried TradingView in 2025. Here's how I found TradingView measured up as a platform in 2026, including against other top options on the market today.
-
Free version:
Yes -
Monthly Pricing:
$14.95/mo -
Annual Pricing:
$155.40/yr
| Ease of Use | |
| Features | |
| Cost |
TradingView pros and cons
PROS
- Powerful charting tool with a massive selection of features, such as over 400 pre-built indicators and over 110 drawing tools.
- Easy to join and start using; it took less than a minute to open an account.
- Active social network to share ideas and user-built strategies for the tool.
- Offers a free plan and free trials of the paid plans.
- AI Chart Copilot provides helpful guidance for designing and understanding charts.
CONS
- The free plan is ad-supported and restricts features like multi-chart layouts and advanced indicators.
- Frequent prompts to upgrade can be annoying when using the free plan.
- All the indicators and other tools can feel overwhelming at first.
- Educational resources are available, but limited guidance within platform.
- AI tool is not built into the platform and must be downloaded as a Chrome extension.
Overall summary
| Feature |
 TradingView TradingView
|
|---|---|
| Overall |
|
| Features |
|
| Ease of Use |
|
| Cost |
|
| Free version | Yes |
| Monthly Pricing | $14.95/mo |
| Annual Pricing | $155.40/yr |
Is TradingView free?
Yes. TradingView has a free Basic plan that covers the core charting tools, though it shows ads and limits you to one chart per tab with two indicators.
Cost and plans
TradingView offers a wide range of plans, from a completely free version to those designed for professional investors. All plans give you access to the main analysis tools and features, such as charting, screeners, and alerts. The more you pay, the more you get in terms of capabilities.
| Plan | Price (Monthly) | Price (Yearly) |
|---|---|---|
| Basic | Free | Free |
| Essential | $14.95/month | $155.40/year |
| Plus | $29.95/month | $299.40/year |
| Premium | $59.95/month | $599.40/year |
| Ultimate | $239.95/month | $2,399.40/year |
Free version
If you want to test TradingView, you can join using a free account. All you need to provide is your email and a password. With a free TradingView account, you can try TradingView’s main charting tool. However, what you can do is limited.

A free account lets you explore TradingView’s main charting platform, with limited features.
With a free account, you can only use one chart per tab to track a single investment at a time. You are also restricted in design, such as only being able to add two indicators per chart. If you try to go beyond your capabilities, you’ll get an ad blocking you and suggesting you sign up for a paid plan. Video commercials also pop up occasionally, which I found to be an annoying distraction from my charts.
The free version is a way to test the waters, but the ads and restrictions will quickly get frustrating if you use it regularly for investment research.

The free plan limits you to one chart per tab and two indicators, with ads and pop-ups appearing if you exceed those limits.
Paid plans
The TradingView paid plans open more capabilities than the free version, such as creating multiple watchlists to organize your research or using customized time frames on your charts (eg. intervals of 54 minutes versus only using hours). There are four paid plans, each with a discount if you sign up annually:
- Essential = $14.95 per month, $155.40 per year ($24 a year saved versus paying monthly)
- Plus = $29.95 per month, $299.40 per year ($60 a year saved versus paying monthly)
- Premium = $59.95 per month, $599.40 per year ($120 a year saved versus paying monthly)
- Ultimate = $239.95 per month, $2,399.40 per year ($480 a year saved versus paying monthly)
You can try Essential, Plus, or Premium for free for 30 days, while Ultimate offers a 14-day free trial. None of these paid plans have ads. The more expensive the plan, the more you can do, especially with the charting tool.
For example, the Essential plan lets you create and manage two charts per tab, Plus lets you create up to four charts, Premium lets you create up to eight, and Ultimate lets you create up to 16. You can add more indicators per chart, set up more alerts, and create more connections as your subscription tier increases (see below).

Higher-tier plans increase chart capacity, from two charts per tab on Essential to eight on Premium, along with more indicators, alerts, and connections.
The Premium subscription also offers more advanced functions than the other plans. For example, it lets you set up volume candles that combine price and time in one chart and set up alerts that don’t expire, which is ideal for long-term strategies. With Essential and Plus, alerts expire after two months, so you must set them up again.
The Ultimate plan is designed for professional investors, and comes with priority support and the option to buy professional market data.
Consider the size of your portfolio and the research needed to find the correct tier and TradingView cost. How many investments do you plan on tracking at once during the trading day? Do you need more than a few indicators per chart? If you’re unsure, take advantage of the 30-day free trial to see just how much power you need from TradingView.
Is TradingView a broker?
No. TradingView is a charting and analysis platform; you connect your own broker to place trades.
Features
TradingView stands out for its Supercharts platform. All the features, such as screeners, alerts, and community input, connect to the charting tool to improve performance.
If you are an active investor or day trader who frequently uses technical analysis to plan trades, this is a powerful combination, but it can feel a little overwhelming for someone who only wants more basic screeners and alerts. Here’s more on how these features work.
Charting
TradingView is primarily a charting platform and one of the very best around. You can create charts for stocks, ETFs, crypto, bonds, futures, and forex. You can also create charts for markets internationally.
You have a massive level of control over designing the charts. Depending on your subscription, you have potential access to:
- Over 100,000 indicators, including over 400 built-in indicators and strategies
- Over 110 smart drawing tools
- Over 20 chart types
- Dozens of drawing tools
- Customizable timeframes
Despite all the tools, I found the charting tool to be very user-friendly compared to other on the market. Each feature is clearly labeled for the charting, and it feels intuitive to add and remove information and save charts.
I also appreciated how easy it was to set up and manage multiple charts at once. With my Premium account, I was able to expand to eight at a time, and despite all the ongoing information, it didn't feel overwhelming to track everything at once.
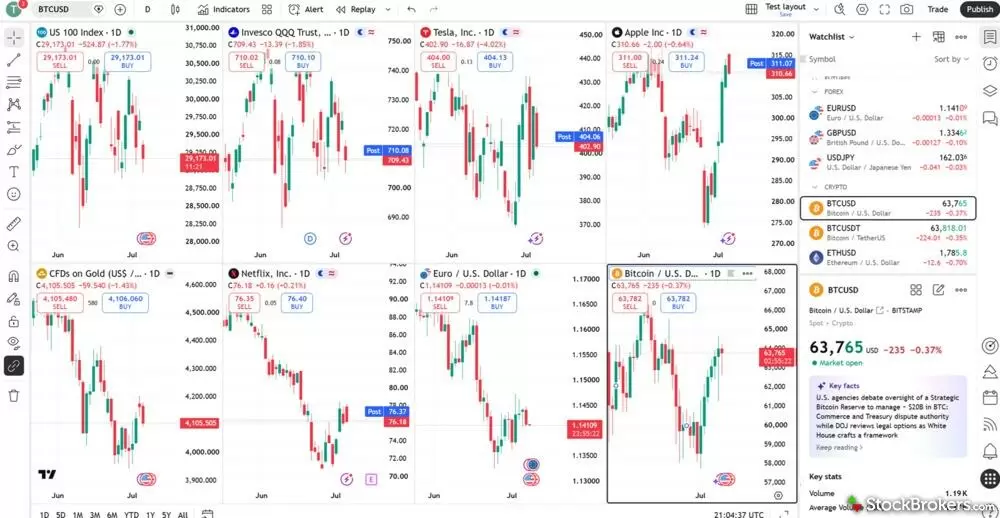
Managing multiple charts on TradingView doesn't need to feel overwhelming, even with all of the information on the screen.
You can link many brokers directly to the charting tool, such as TradeStation, tastytrade, and Interactive Brokers. That way, you can process trades while still on the TradingView platform and react immediately to market trends, when every second counts.
You see your screeners, watchlists, market news, and other information all on the charting platform. I found that my interface would get cluttered quickly with everything I added, but it was easy enough to minimize the tools I wasn't using.
AI Chart Copilot
In 2026, TradingView released its AI Chart Copilot tool. This chatbot lets users ask questions while on the charting platform for advice on designing charts and to gather insights.
It was still in its beta phase during my testing, and I definitely ran into some kinks. The copilot wouldn't work directly in the platform, so I had to download a separate Chrome extension for it to work. Chat requests took a considerable amount of time, sometimes a minute or longer. And there was a strict limit on how many queries I could make per week, even on a paid plan.
All that said, I can see the potential of this new tool. It worked with me to identify my target trading strategy, and through that, built a complex chart that made sense for my investment. I also liked how it could quiz me on my charts, asking me to identify patterns myself rather than giving away the answer immediately. If you're new to technical analysis, it works like your own personal tutor.
This new tool should be especially valuable to newer traders after TradingView works out the issues.
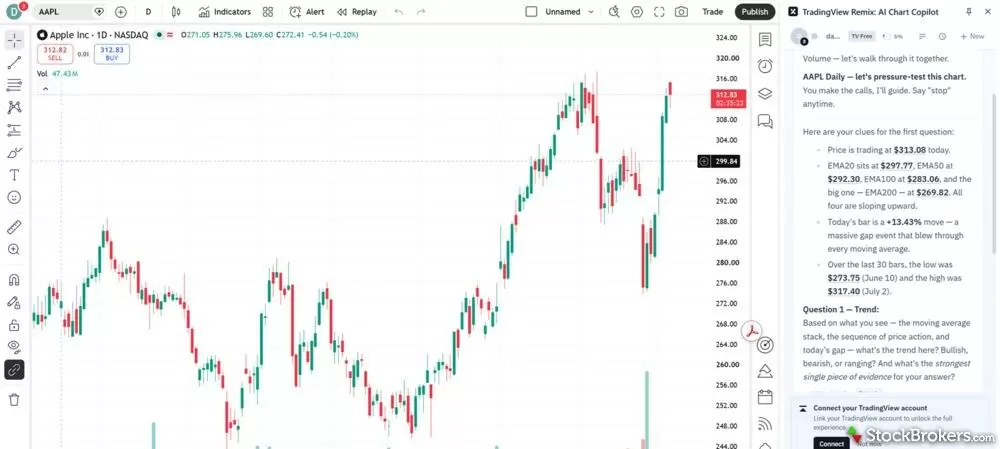
TradingView's Chart Copilot helps develop strategies, identify trends, and can even quiz users on their existing charts.
Screeners
If you’re trying to identify your next investment, TradingView offers screeners for stocks, bonds, ETFs, crypto, crypto pairs, DEX, and CEX. This tool lets you sort through thousands of possible investments across data like recent price changes, P/E ratios, revenue growth, and dividend yield.
TradingView also gives some input on the quality of investments, for example, showing what percentage of a return on equity is profitable versus not profitable. For more advice, TradingView includes analyst ratings and its own ratings for investments. You can access this same screening information on the charting tool as well.
I enjoyed the agility of TradingView's system. For example, they provide an auto-save feature. While building a complex screen with many criteria, I could switch to my charts without worrying about losing progress. At the same time, if I added something that didn't fit, I could hit CTRL+Z and immediately undo it. It just felt much more user-friendly than the typical screener.
The TradingView screener is decent, with a large selection of metrics and the ability to screen investments in both U.S. and international markets. If you want even more data, there are companies specializing in screeners that provide even more metrics, like Stock Rover. However, the TradingView capabilities are enough for the typical investor, especially since they can be used right on the charting tool.
In addition to the screening tools, TradingView offers heatmaps. You can pick a sector or index and see the overall performance. That can visually help you see trends and find opportunities. TradingView’s heatmaps are easy to set up and visually effective. They handle this feature well.
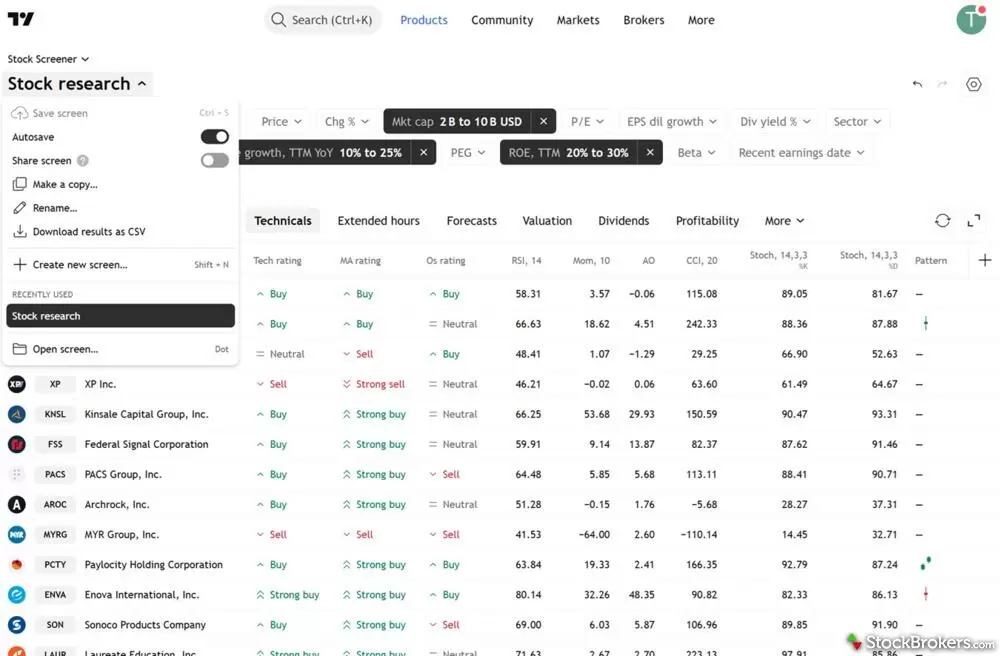
TradingView's screener makes it easy to build and reverse complex research strategies over time, including saving them for later.
Watchlists and Alerts
TradingView lets you quickly set up watchlists for investments you want to watch for real-time market data. You get a basic view of your watchlist on the charting platform and can dive deeper into that information on the watchlist page.

Set up customizable watchlists with live market data, accessible directly from the charting platform or in more detail on the watchlist tab.
More importantly, TradingView allows you to set up investment alerts, such as price changes or alerts that trigger a strategy you’ve drawn on your chart. If so, you’ll receive alarms and pop-ups if you are on the TradingView platform, as well as email and SMS notifications.
While watchlists and alerts are common features on investment platforms, I was impressed by the sheer volume and versatility at TradingView. With a Premium plan, you can set up hundreds of price and technical alerts at once, helping you keep track of a large portfolio with tons of data automatically.

TradingView supports customizable price and technical alerts, with platform, email, and SMS notifications.
Bar Replay
TradingView offers a Bar Replay function that lets you look at historical market data on a chart and see how your strategies would have worked. It’s a way to test trading strategies and charting functions without committing money in real time.
You pick the timeframe for your target investment. You then hit play, like a video. TradingView will slowly show the pricing data and any strategy you set up to test.
You can fast-forward and rewind until you find patterns that you think would be useful for trading in the future. The Bar Replay function is unique and not seen on other popular charting tools. It’s a nice addition for investors who want to backtest past strategies and practice trading without losing money.

TradingView’s Bar Replay lets you replay historical price data to test strategies and practice trading without risking real money.
Community Ideas and Strategies
TradingView prides itself on having an active investor community working together to share ideas and strategies. TradingView actually describes itself as a social network on top of a charting platform, showing how committed it is to connecting investors.
TradingView also runs a Community Ideas forum where popular users post ideas and thoughts on market conditions. You can even download and use analysis tools built and designed for the TradingView trading platform. This creates way more possibilities for the platform. For example, TradingView has built roughly 400 indicators and strategies itself, but users have developed over 100,000 additional public indicators.
Investing can get lonely, especially as you try to develop new strategies, so this active community could help you stay motivated.
Ease of use
TradingView is generally easy to use, if you're an experienced investor. It took me less than a minute to create a free account and start experimenting for our TradingView review. The different research tools are all easy to find. The more basic tools, like the screeners, are also easy to figure out as a first-timer.
However, the charting tool can feel a little overwhelming, especially to beginner investors new to charting and technical analysis. There’s a ton going on and many functions to navigate. The tools are labeled, but there are limited instructions on what each one does. While it’s simple enough to dive in and start creating charts, there isn’t much explanation on how to do so effectively. When you first join, the welcome video focuses more on rock climbing than the platform itself.
For more help, you can go to the extensive TradingView Knowledge Base. Here, you can find detailed articles and videos on TradingView. Beginners may prefer a tool with more support built throughout the charts themselves, but TradingView is designed with the impression that you already know what you’re getting into.
TradingView seems to be moving in this direction as their AI Copilot is providing the kind of hands-on support and guidance I would have loved when I first tried the platform.
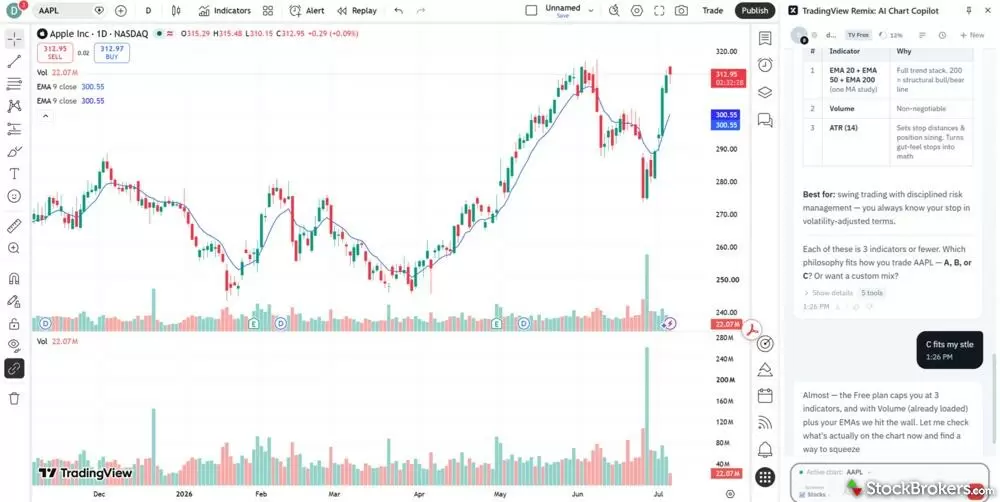
The Chart Copilot quickly helps new users unlock more advanced capabilities, improving ease-of-use significantly compared to the past.
Final thoughts
Is TradingView worth it?
TradingView deserves its place as one of the most popular investment tools on the market today. Its charting platform is robust, with tons of research features. Despite the almost overwhelming amount of capabilities, the platform is well-designed so that you can dive right in.
I also loved the community aspect of this tool that lets you work with the over 100 million other investors on TradingView. Ultimately, TradingView offers something for investors of all types, from its free version that appeals to beginners to plans designed for professional investors.
Alternatives to TradingView
If you want something low-cost or free, you could potentially gain more charting features from Stock Rover. StockCharts also does a better job building in education to teach you technical analysis while you use the tools; you don’t have to go to a separate educational library like TradingView.
Finally, while you can connect TradingView to your broker to make trades, some investors may prefer handling research through their broker, so they only have one account. Fidelity and TradeStation are two brokers that provide decent charting. All that being said, investors who want top-notch charting capabilities will have trouble finding something better than TradingView.
FAQs
How do you paper trade on TradingView?
TradingView offers paper trading automatically through its charting platform. This lets you practice trades with free money to test the platform and your strategies. At the bottom of the charting tool, you’ll see the Trading Panel. Here, you can either link your broker or select Paper Trading.
If you log into your Paper Trading account, you’ll start with $100,000 of play money. From there, when you execute trades, they’ll happen using your free money. Over time, you can see how you would have performed. You can request more free money from TradingView if you run out by resetting the account.

TradingView includes built-in paper trading, letting you practice strategies with a $100,000 virtual balance directly from the charting platform.
Does TradingView provide buy and sell signals?
Yes, TradingView provides buy and sell signals through its indicators and alerts. You pick what indicators you want to use for your charts, such as relative strength.
These indicators will then flash according to their process. For example, an exponential moving index indicator can help show when a stock is overbought or oversold on your chart to help with trade decisions. You can also use analyst ratings on the screeners to see buy and sell recommendations for different assets.
Does TradingView have a trading journal?
No, TradingView doesn’t have a built-in trading journal as part of its tool suite. While it offers charting, analysis, and paper trading features, traders looking to log and analyze their trade history will need to use a third-party journal. For the best options, check out our guide to the best trading journals.
Can you do automatic trading with TradingView?
Yes, you can do automatic trading with TradingView. You must combine the alert function with a broker allowing automated trades. You will also need to link a trading bot or API that will receive the email alerts from TradingView to trade on your behalf. With this setup, email alerts will automatically trigger trades through your broker.
Is TradingView free?
Yes, TradingView does offer a free version, and it’s a great way to test the waters before committing to a paid plan. I opened a free account in under a minute, no credit card required, and was able to access the core charting tools immediately. You’ll get a single chart per tab, a couple of indicators, and access to TradingView’s community content and screeners.
That said, it’s not without limits. Ads pop up, multi-chart layouts are restricted, and you’ll quickly run into alerts telling you a feature is locked behind a paywall. If you're just exploring or learning technical analysis, it’s more than enough. But once you get serious about building strategies or tracking multiple markets at once, you’ll likely feel the push toward a paid tier.
Is TradingView legit?
Yes, TradingView is a legitimate charting and analysis platform used by over 100 million traders and investors worldwide. It's a charting and social platform rather than a broker, so it doesn't hold your money or execute your trades. You keep your funds with your own regulated broker and connect that account to TradingView to trade. During testing, I opened an account in under a minute and used the core charting tools right away.
Are there any free alternatives to TradingView?
You can get free charting through brokers such as Fidelity and TradeStation. Other companies like Stock Rover and Yahoo Finance also offer free charting. Keep in mind that TradingView offers a free plan as well. You access all the same tools, just with ads and restricted capabilities.
StockBrokers.com Review Methodology
Why you should trust us
David Rodeck, a contributing writer for StockBrokers.com, has over a decade of writing experience specializing in investing, trading, and retirement planning. Before becoming a full-time writer, David was a financial advisor and passed the Series 6 and CFP exams. He has written for AARP, Kiplinger Magazine, Forbes Advisor, and Investopedia.
Blain Reinkensmeyer, co-founder of StockBrokers.com, has been investing and trading for over 25 years. After having placed over 2,000 trades in his late teens and early 20s, he became one of the first in digital media to review online brokerages. Today, Blain is widely respected as a leading expert on finance and investing, specifically the U.S. online brokerage industry. Blain has been quoted in The New York Times, The Wall Street Journal, Forbes, and Fast Company, among others. Blain created the original scoring rubrics for StockBrokers.com and oversees all testing and rating methodologies.
How we tested
- We used paid trading tool accounts for testing.
- We collected dozens of data points across the tools we review.
- We tested each tool’s website, desktop platforms, and mobile app, where applicable.
- We maintained strict editorial independence; trading tools cannot pay for a higher rating.
Our researchers thoroughly test a wide range of popular trading tools' features, such as trading journals and screeners, charting providers, and educational resources. We also evaluate the overall design of each tool’s mobile experience and look for a fluid user experience moving between mobile and desktop tools.
At StockBrokers.com, our reviewers use a variety of devices to evaluate trading tools. Our reviews and data collection are conducted using the following devices: iPhone SE running iOS 17.5.1, MacBook Pro M1 with 8 GB RAM running the current MacOS, and a Dell Vostro 5402 laptop i5 with 8 GB RAM running Windows 11 Pro.
Each trading tool was evaluated and scored across three key categories: Ease of Use, Features, and Cost. Learn more about how we test.
Trading tools tested in 2026
We tested 11 trading tools and service providers for stock traders in 2026:
Read next
Read our Finviz review and see how it delivers advanced filtering, interactive heat maps, and in-depth financial visualizations.
David Rodeck August 25, 2026
Read our Stock Rover review and learn how its advanced screeners, portfolio insights, and research tools stack up for serious, data-driven investors.
David Rodeck September 14, 2026
Read our Trade Ideas review to see how Holly AI and Money Machine deliver daily AI-powered trading strategies, backtesting, and real-time market scans.
Steven Hatzakis June 15, 2026
Discover if TrendSpider is right for you in this in-depth review. Explore its AI trading bots, chart tools, pricing plans, and how it compares to alternatives like TradingView and StockHero.
David Rodeck July 28, 2026Trading tool guides
Compare the best AI trading platforms, apps, and bots for 2026. We tested Trade Ideas, TrendSpider, and more to find the top AI stock trading tools for every type of investor.
Steven Hatzakis September 18, 2026
Download a free trading journal spreadsheet in Excel or Google Sheets to track profits, losses, and lessons learned. Build better trading habits today.
Blain Reinkensmeyer September 17, 2026
Learn to trade stocks step by step: open a broker account, practice with a simulator, and place your first trade. A beginner's guide from a 25-year trader.
Blain Reinkensmeyer August 26, 2026
Discover the best free and paid stock screeners. Compare TradingView, Finviz, Yahoo Finance, and more to find the right tool for stock filtering and analysis.
Blain Reinkensmeyer September 14, 2026
We tested the best trading journals of 2026. See why Tradervue tops our list, plus top picks for free journals, mobile apps, and every asset class.
David Rodeck August 25, 2026
TradingView, StockCharts, and Yahoo Finance offer the best free stock charts. Compare features, fees, and free vs. paid tiers for the top 5 tools of 2026.
Blain Reinkensmeyer June 04, 2026Other guides
Find the best rollover IRA accounts. Compare Fidelity, Schwab, and E*TRADE for easy transfers, low fees, and smart retirement investing tools.
Andrea Coombes May 15, 2026
Find the best Roth IRA accounts. Fidelity, Schwab, and E*TRADE lead with low fees, smart investing tools, and retirement planning support.
Andrea Coombes April 27, 2026
Explore the best international brokers for U.S. investors. Compare Interactive Brokers, Charles Schwab, and Fidelity for global stock trading access.
Jessica Inskip May 22, 2026
Practice investing risk-free with the best paper trading platforms. Compare Webull, Schwab, Interactive Brokers, E*TRADE, and more.
Jessica Inskip July 24, 2026
Find the best penny stock brokers. Compare Fidelity, Firstrade, Schwab, E*TRADE, and TradeStation for OTC access, fees, and tools.
Jessica Inskip August 02, 2026
Find the best crypto trading platform for 2026. We rank eToro, Fidelity, Interactive Brokers, Webull, and Robinhood on fees, security, and coin selection.
Steven Hatzakis May 27, 2026
Interactive Brokers and Fidelity lead our 2026 ranking of the best free stock trading platforms, tested on the true cost of $0 commissions and hidden fees.
Jessica Inskip September 02, 2026
We tested the best options trading platforms for 2026. Compare tastytrade, Fidelity, IBKR, E*TRADE & Schwab on tools, fees, and picks for beginners.
Jessica Inskip September 09, 2026
Discover the best stock brokers of 2026. Compare Schwab, Fidelity, Interactive Brokers, E*TRADE, and more to find the top trading platform for your needs.
Jessica Inskip August 06, 2026
Find the top bank brokerages. From Merrill Edge to Ally, discover brokers that combine banking, investing, and rewards in one account.
Jessica Inskip April 16, 2026
Discover the best brokers for trade execution. Compare Fidelity, Interactive Brokers, and more for price improvement, speed, and transparency.
Jessica Inskip May 22, 2026
Start investing with ease. Explore the best beginner-friendly trading platforms with low fees, great education, and intuitive apps.
Jessica Inskip August 06, 2026
Find the best IRA accounts. Compare Fidelity, Schwab, Merrill Edge, E*TRADE, & J.P. Morgan for retirement planning, fees, tools, and account flexibility.
Jessica Inskip March 31, 2026
Find the best brokerage for high-net-worth investors. Compare Fidelity, Schwab, Merrill, and more for premium services and tailored investment tools.
Jessica Inskip January 27, 2026
Find top U.S. forex brokers. From tastyfx to OANDA, explore platforms with strong regulation, great tools, and user-friendly trading.
Steven Hatzakis May 29, 2026
Discover the best day trading platforms. Compare IBKR, Schwab, Fidelity, E*TRADE, and TradeStation for speed, tools, and margin rates.
Jessica Inskip August 03, 2026
We tested the 5 best futures trading platforms of 2026. Compare commissions, margin rates, and tools for beginners and active traders. Find the right platform for you.
Jessica Inskip September 17, 2026About the Editorial Team
David Rodeck is a financial writer based in New York City. He specializes in making investing, trading, and retirement planning understandable. David’s work has appeared in AARP, Kiplinger, Forbes Advisor, and Investopedia. Before writing full-time, David was a financial advisor and passed the Series 6 and CFP exams.
Jeff Anberg is a Senior Editor at StockBrokers.com. Along with years of experience in media distribution at a global newsroom, Jeff has a versatile knowledge base encompassing the technology and financial markets. He is a long-time active investor and engages in research on emerging markets like cryptocurrency. Jeff holds a Bachelor’s Degree in English Literature with a minor in Philosophy from San Francisco State University.
Joey Shadeck is the Content Strategist and Research Analyst for StockBrokers.com. He holds dual degrees in Finance and Marketing from Oakland University, and has been an active trader and investor for close to 10 years. An industry veteran, Joey obtains and verifies data, conducts research, and analyzes and validates our content.