Range of investments
Bottom line: Both Interactive Brokers and J.P. Morgan Self-Directed Investing cover the core needs—stocks, ETFs, mutual funds, options, margin, fractional shares, and OTC stocks—but Interactive Brokers stands out for sheer market access. It adds forex, futures, and crypto trading (11 coins), earning 5 stars and the #1 spot out of 14 for Range of Investments from StockBrokers.com. J.P. Morgan Self-Directed Investing lacks forex, futures, and crypto, scoring 3.5 stars and ranking #13, though it does offer advisor services, which Interactive Brokers does not. Both support Traditional and Roth IRAs.
Similarities include stock trading, margin trading, fractional shares, OTC stocks, mutual funds, and options—available at both brokers. Where they differ is in specialty markets: Interactive Brokers offers forex and futures, while J.P. Morgan Self-Directed Investing does not. For digital assets, Interactive Brokers provides crypto trading in 11 coins; J.P. Morgan Self-Directed Investing offers none.
If you want the widest mix of asset classes in a single platform, Interactive Brokers is the stronger choice. If access to advisor services within a self-directed setup matters more, J.P. Morgan Self-Directed Investing may fit better. For retirement savers, both offer Traditional and Roth IRA accounts.
|
Feature |
 Interactive Brokers Interactive Brokers
|
 J.P. Morgan Self-Directed Investing J.P. Morgan Self-Directed Investing
|
|
Stock Trading
info
|
Yes
|
Yes
|
|
Account Feature - Margin Trading
info
|
Yes
|
Yes
info |
|
Fractional Shares (Stocks)
info
|
Yes
|
Yes
|
|
OTC Stocks
info
|
Yes
|
Yes
|
|
Mutual Funds
info
|
Yes
|
Yes
|
|
Options Trading
info
|
Yes
|
Yes
|
|
Futures Trading
info
|
Yes
|
No
|
|
Crypto Trading
info
|
Yes
info |
No
|
|
Crypto Trading - Total Coins
info
|
11
info |
0
|
|
Range of Investments
|

|

|
Dive deeper: Best Options Trading Platforms for 2026, Best Futures Trading Platforms for 2026
Trading platforms and tools
Interactive Brokers clearly outclasses J.P. Morgan Self-Directed Investing for trading platforms and tools. IBKR earns 4.5/5 stars and ranks #2 of 14 at StockBrokers.com, while J.P. Morgan Self-Directed Investing scores 1/5 stars and ranks #13. In plain terms: if you want advanced platform access and deep charting for active trading, choose Interactive Brokers; if you only need very basic web trading, J.P. Morgan Self-Directed Investing may suffice.
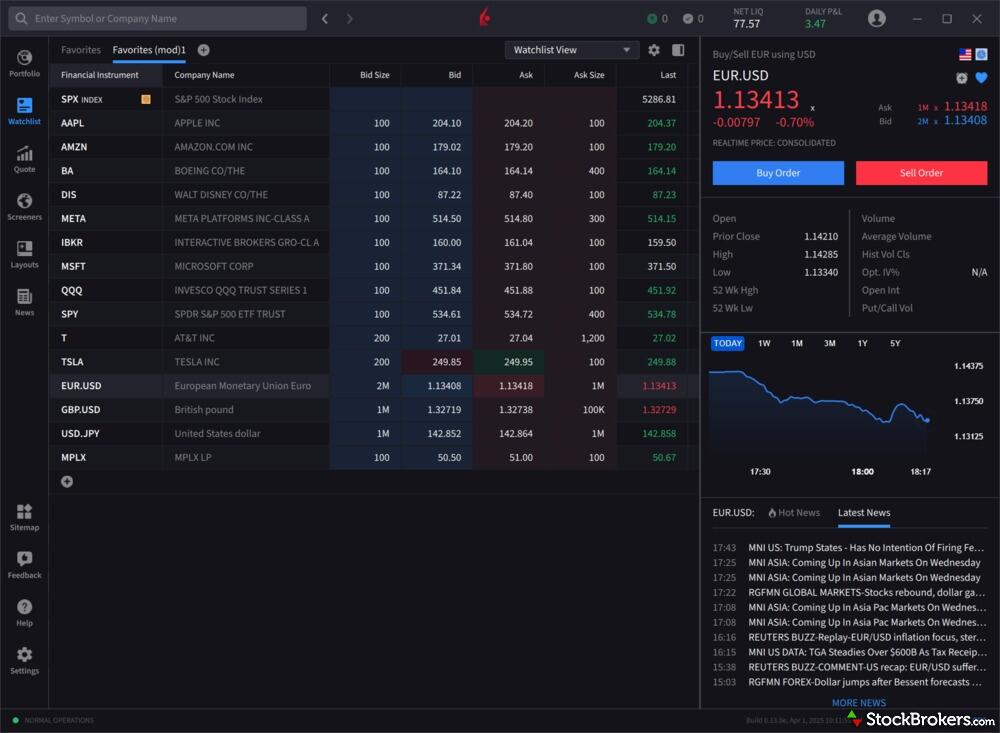
Platform access and core tools show a wide gap. Interactive Brokers offers downloadable desktop platforms for both Windows and Mac, plus a browser-based platform; J.P. Morgan Self-Directed Investing offers only a browser-based platform. IBKR also includes paper trading and a built-in trading journal, which J.P. Morgan Self-Directed Investing lacks. Watchlists are far more flexible with Interactive Brokers (up to 659 data columns versus 20), and IBKR lets you adjust open orders directly on a stock chart, something J.P. Morgan Self-Directed Investing does not support.
Charting is another standout area for Interactive Brokers. IBKR provides 155 technical indicators and 85 drawing tools, compared with 36 indicators and 10 drawing tools at J.P. Morgan Self-Directed Investing. Interactive Brokers lets you add notes to charts, view historical trades, set custom date ranges, run automated chart pattern recognition, and save multiple chart profiles; J.P. Morgan Self-Directed Investing lacks all of those except showing corporate events (both brokers support that). Even simple study edits go further on IBKR (6 customization fields for an SMA vs. 3). Neither broker supports creating fully custom studies.
|
Feature |
 Interactive Brokers Interactive Brokers
|
 J.P. Morgan Self-Directed Investing J.P. Morgan Self-Directed Investing
|
|
Web Trading Platform
info
|
Yes
|
Yes
|
|
Desktop Trading Platform
info
|
Yes
|
No
|
|
Desktop Platform (Mac)
info
|
Yes
|
No
|
|
Paper Trading
info
|
Yes
|
No
|
|
Watchlists - Total Fields
info
|
659
|
20
|
|
Charting - Indicators / Studies
info
|
155
|
36
|
|
Charting - Drawing Tools
info
|
85
|
10
|
|
Advanced Trading
|

|

|
Dive deeper: Best Stock Brokers for 2026, Best Paper Trading Apps & Platforms for 2026
A full-featured account for investing
Get up to $1K on new brokerage account*
Beginners and education
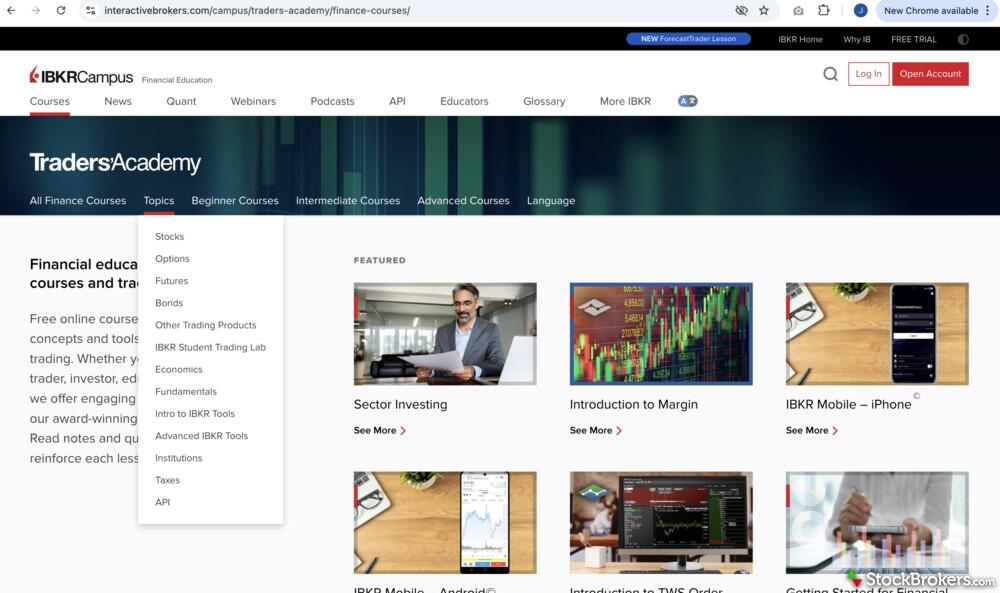
Interactive Brokers and J.P. Morgan Self-Directed Investing both support beginner investors with broad education on stocks, ETFs, options, mutual funds, and bonds, plus educational videos and webinars. Each earns 4 out of 5 stars for education. In StockBrokers.com’s ranking of 14 brokers, Interactive Brokers places #3 while J.P. Morgan Self-Directed Investing places #4.
The key differences are hands-on practice and structured learning. Interactive Brokers offers paper trading to practice without risking money, along with quizzes and tools to track your learning progress. J.P. Morgan Self-Directed Investing does not include those features. If you want practice and progress tracking, Interactive Brokers has the edge; if you prefer straightforward topic coverage with videos and webinars, J.P. Morgan Self-Directed Investing fits the bill.
|
Feature |
 Interactive Brokers Interactive Brokers
|
 J.P. Morgan Self-Directed Investing J.P. Morgan Self-Directed Investing
|
|
Education (Stocks)
info
|
Yes
|
Yes
|
|
Education (ETFs)
info
|
Yes
|
Yes
|
|
Education (Options)
info
|
Yes
|
Yes
|
|
Education (Mutual Funds)
info
|
Yes
|
Yes
|
|
Education (Fixed Income)
info
|
Yes
|
Yes
|
|
Videos
info
|
Yes
|
Yes
|
|
Webinars
info
|
Yes
|
Yes
|
|
Education
|

|

|
Dive deeper: Best Stock Trading Platforms for Beginners of 2026
Stock trading apps
Bottom line: Interactive Brokers offers the stronger stock trading app experience than J.P. Morgan Self-Directed Investing. Interactive Brokers earns 5 stars and ranks #2 out of 14 in StockBrokers.com’s app ratings, while J.P. Morgan scores 4 stars and ranks #10. Both handle everyday trading, but Interactive Brokers pulls ahead on streaming data, deeper charts, and extra viewing options, making it the better pick for active traders and investors who want more tools on the go.
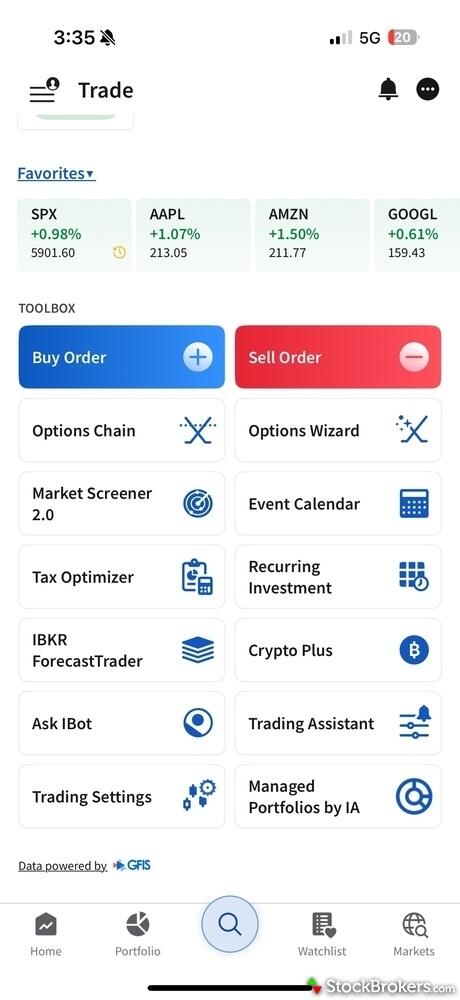
App availability and core features: Both brokers offer iPhone and Android apps plus mobile options trading. Interactive Brokers also supports Apple Watch. Interactive Brokers enables mobile after-hours trading; J.P. Morgan’s after-hours availability on mobile is not confirmed. For market data, Interactive Brokers provides streaming quotes, while J.P. Morgan does not. Both apps support stock alerts, custom watch lists, and customizing watch list columns.
Charts and research on mobile: Interactive Brokers includes after-hours charting, streaming live TV, and video on demand; J.P. Morgan lacks these. Both apps let you rotate to landscape and view multiple time frames, but Interactive Brokers offers 97 technical studies versus J.P. Morgan’s 36. Interactive Brokers also lets you compare multiple stocks on one chart, a feature not available in J.P. Morgan’s app.
Dive deeper: Best Stock Trading Apps for 2026
Fees
Bottom line: Interactive Brokers vs. J.P. Morgan Self-Directed Investing comes down to margin interest and a few one-time fees. Both have $0 account minimums, $0 stock commissions, and the same $0.65 per options contract. But Interactive Brokers is much cheaper for margin borrowing and doesn’t charge for full ACAT transfers or IRA closures, while J.P. Morgan Self-Directed Investing charges $75 for each. If you plan to use margin or might move or close an account, Interactive Brokers is the lower-cost pick; if you only place stock or options trades, pricing is essentially the same.
Entry costs and trade pricing are a tie: each offers a $0.00 minimum deposit and $0.00 commissions for regular stock trades. Options contract fees are also identical at $0.65 per contract. Options exercise and assignment fees are $0.00 at both brokers.
The differences show up in borrowing and account maintenance. For margin, Interactive Brokers is 6.83% for balances below $25,000, 6.83% for $25,000–$49,999, and 6.83% for $50,000–$99,999; J.P. Morgan Self-Directed Investing is 12.25%, 12%, and 11.5% for those same tiers. IRA annual fees are $0.00 at both, but IRA closure is $0.00 at Interactive Brokers vs. $75.00 at J.P. Morgan Self-Directed Investing. ACAT transfers are $0.00 for partial at both, while full transfers cost $0.00 at Interactive Brokers and $75.00 at J.P. Morgan Self-Directed Investing.
|
Feature |
 Interactive Brokers Interactive Brokers
|
 J.P. Morgan Self-Directed Investing J.P. Morgan Self-Directed Investing
|
|
Minimum Deposit
info
|
$0.00
|
$0.00
|
|
Stock Trades
info
|
$0.00
|
$0.00
|
|
Options (Per Contract)
info
|
$0.65
info |
$0.65
|
|
Options Exercise Fee
info
|
$0.00
|
$0.00
|
|
Options Assignment Fee
info
|
$0.00
|
$0.00
|
|
IRA Annual Fee
info
|
$0.00
|
$0.00
|
|
IRA Closure Fee
info
|
$0.00
|
$75.00
|
Dive deeper: Best Free Trading Platforms for 2026
Day Trading
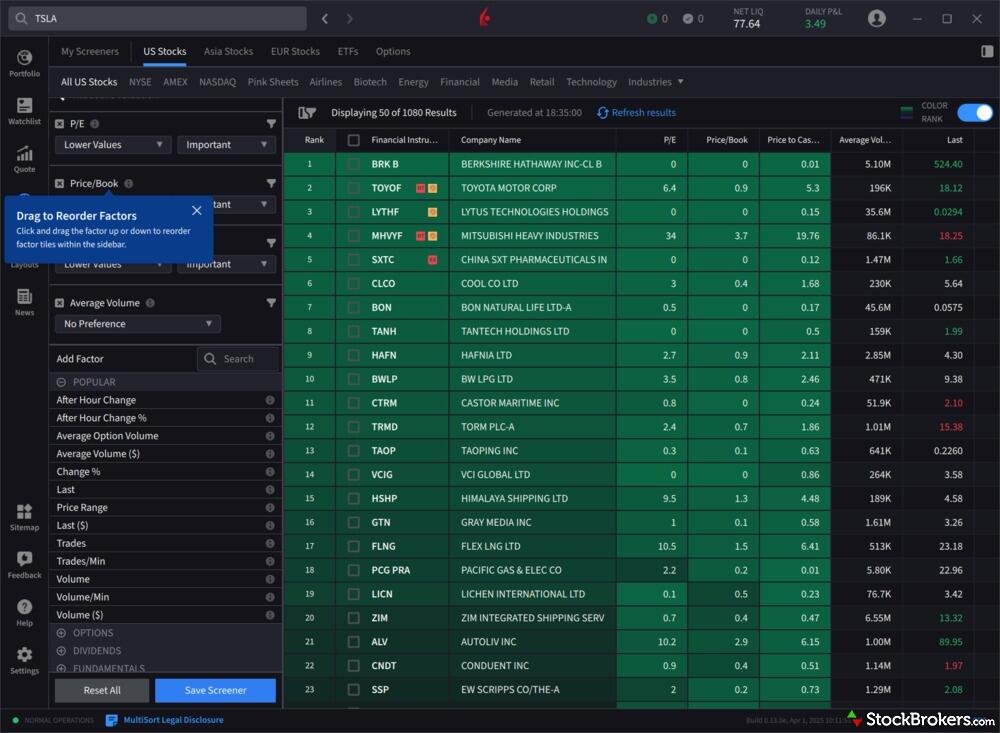
When it comes to day trading, Interactive Brokers sets itself apart from J.P. Morgan Self-Directed Investing with a suite of features designed for active traders. Interactive Brokers provides streaming time and sales data for stocks, ensuring that traders have immediate access to crucial information. Additionally, it offers streaming live TV, enabling traders to stay updated with the latest market news and trends. Advanced functionalities like direct market routing, ladder trading, and trading hotkeys for easy trade entries further enhance the trading experience. Level 2 quotes and both basic and advanced strategy backtesting tools make Interactive Brokers a comprehensive choice for those looking to employ sophisticated trading strategies.
In contrast, J.P. Morgan Self-Directed Investing lacks several key features for day traders. It does not offer streaming time and sales, live TV broadcasts, or the ability to directly route orders. Furthermore, trading tools such as ladder trading, trading hotkeys, and level 2 quotes are absent. This platform also falls short in providing both basic and advanced strategy backtesting options, and does not include a short locator tool for assessing real-time short sale availability. Moreover, traders looking to capitalize on order liquidity rebates will find this feature lacking. As a result, Interactive Brokers appears to offer a more tailored environment for day trading enthusiasts.
|
Feature |
 Interactive Brokers Interactive Brokers
|
 J.P. Morgan Self-Directed Investing J.P. Morgan Self-Directed Investing
|
|
Streaming Time & Sales
info
|
Yes
|
No
|
|
Streaming TV
info
|
Yes
|
No
|
|
Direct Market Routing - Equities
info
|
Yes
|
No
|
|
Level 2 Quotes - Stocks
info
|
Yes
|
No
|
|
Trade Ideas - Backtesting
info
|
Yes
|
No
|
|
Trade Ideas - Backtesting Adv
info
|
Yes
|
No
|
|
Short Locator
info
|
Yes
|
No
|
Dive deeper: Best Day Trading Platforms of 2026 for Beginners and Active Traders
Market Research
Bottom line: both Interactive Brokers and J.P. Morgan Self-Directed Investing deliver broad market research, but Interactive Brokers pulls ahead with more depth and extras. It earns 4.5 stars and ranks #5 out of 14 for research, while J.P. Morgan Self-Directed Investing earns 4 stars and ranks #7. If you want more data and more downloadable reports, Interactive Brokers is the stronger pick; if you just need the basics done well, J.P. Morgan Self-Directed Investing fits the bill.
Each broker covers research for stocks, ETFs, mutual funds, bonds, and Pink Sheets/OTCBB, and both let you view portfolio allocation by asset class. They also include screeners for trade ideas across stocks, ETFs, mutual funds, and bonds. Where they differ is in report access: Interactive Brokers offers 17 downloadable PDF stock research reports and also provides PDF reports for ETFs and mutual funds; J.P. Morgan Self-Directed Investing offers 2 downloadable PDF stock research reports and does not provide PDFs for ETFs or mutual funds.
Interactive Brokers adds advanced angles like stock research using social media sentiment data and ESG (Environmental, Social, and Governance) research—features J.P. Morgan Self-Directed Investing does not include. If those extra lenses matter to you, Interactive Brokers is likely the better match; if you want core coverage with screeners and fundamental research, J.P. Morgan Self-Directed Investing will meet your needs.
|
Feature |
 Interactive Brokers Interactive Brokers
|
 J.P. Morgan Self-Directed Investing J.P. Morgan Self-Directed Investing
|
|
Research - Stocks
info
|
Yes
|
Yes
|
|
Screener - Stocks
info
|
Yes
|
Yes
|
|
Research - ETFs
info
|
Yes
|
Yes
|
|
Screener - ETFs
info
|
Yes
|
Yes
|
|
Research - Mutual Funds
info
|
Yes
|
Yes
|
|
Screener - Mutual Funds
info
|
Yes
|
Yes
|
|
Research - Fixed Income
info
|
Yes
|
Yes
|
|
Screener - Fixed Income
info
|
Yes
|
Yes
|
|
Research
|

|

|
Banking
When you compare the banking features of Interactive Brokers to J.P. Morgan Self-Directed Investing, the difference is clear: J.P. Morgan offers a fuller set of bank-like services, including checking and savings accounts, a debit card, credit cards, mortgage loans, and certificates of deposit (CDs). Interactive Brokers focuses more on investing and does not provide checking or savings accounts, a debit card, or mortgages, though it does offer a credit card and CDs. If you want everyday banking and investing under one roof, J.P. Morgan Self-Directed Investing is the stronger fit, while Interactive Brokers suits traders who only need select banking extras like a credit card and CDs.
Dive deeper: Best Brokerage Checking Accounts for 2026
Winner
After opening live accounts and testing 14 of the best online brokers, our research and live account testing finds that Interactive Brokers is better than J.P. Morgan Self-Directed Investing. Interactive Brokers finished with an overall score of 90.6%, while J.P. Morgan Self-Directed Investing finished with a score of 67.5%.
Interactive Brokers is a go-to choice for professionals because of its institutional-grade desktop trading platform, high-quality trade executions and low margin rates.
FAQs
Can you trade cryptocurrency with Interactive Brokers or J.P. Morgan Self-Directed Investing?
Interactive Brokers stands out as a robust online broker, offering cryptocurrency trading with access to 11 different coins, while J.P. Morgan Self-Directed Investing does not currently provide any crypto trading options, making Interactive Brokers a preferable choice for investors interested in digital currencies.
Dive deeper: Best Online Brokers for Crypto Trading in 2026
Does Interactive Brokers or J.P. Morgan Self-Directed Investing offer IRAs?
Both Interactive Brokers and J.P. Morgan Self-Directed Investing offer traditional and Roth IRA accounts with zero annual fees; however, while Interactive Brokers does not charge a closure fee for IRA accounts, J.P. Morgan Self-Directed Investing imposes a $75 closure fee.
Dive deeper: Best IRA Accounts for 2026
Popular trading guides
More trading guides
Popular broker reviews
navigate_before
navigate_next
|
Broker Screenshots
|
Interactive Brokers |
J.P. Morgan Self-Directed Investing |
|
|
Broker Gallery (click to expand) |
|
|
|
|
Trading Fees
|
Interactive Brokers |
J.P. Morgan Self-Directed Investing |
|
|
Minimum Deposit info
|
$0.00
|
$0.00
|
|
|
Stock Trades info
|
$0.00
|
$0.00
|
|
|
Penny Stock Fees (OTC) info
|
$0.01
|
$0.00
|
|
|
Mutual Fund Trade Fee info
|
$14.95
info
|
$0
|
|
|
Options (Per Contract) info
|
$0.65
info
|
$0.65
|
|
|
Futures (Per Contract) info
|
$0.85
info
|
(Not offered)
|
|
|
Broker Assisted Trade Fee info
|
Varies
info
|
Varies
|
|
|
Margin Rates
|
Interactive Brokers |
J.P. Morgan Self-Directed Investing |
|
|
Margin Rate Under $25,000 info
|
6.83%
info
|
12.25%
|
|
|
Margin Rate $25,000 to $49,999.99 info
|
6.83%
info
|
12%
|
|
|
Margin Rate $50,000 to $99,999.99 info
|
6.83%
info
|
11.5%
|
|
|
Margin Rate $100,000 to $249,999.99 info
|
6.83%
info
|
11.25%
|
|
|
Margin Rate $250,000 to $499,999.99 info
|
6.83%
info
|
11.25%
|
|
|
Margin Rate $500,000 to $999,999.99 info
|
6.83%
info
|
10.5%
|
|
|
Margin Rate Above $1,000,000 info
|
6.83%
info
|
10%
info
|
|
|
Account Fees
|
Interactive Brokers |
J.P. Morgan Self-Directed Investing |
|
|
IRA Annual Fee info
|
$0.00
|
$0.00
|
|
|
IRA Closure Fee info
|
$0.00
|
$75.00
|
|
|
Account Transfer Out (Partial) info
|
$0.00
|
$0.00
|
|
|
Account Transfer Out (Full) info
|
$0.00
|
$75.00
|
|
|
Options Exercise Fee info
|
$0.00
|
$0.00
|
|
|
Options Assignment Fee info
|
$0.00
|
$0.00
|
|
|
Investment Options
|
Interactive Brokers |
J.P. Morgan Self-Directed Investing |
|
|
Stock Trading info
|
Yes
|
Yes
|
|
|
Account Feature - Margin Trading info
|
Yes
|
Yes
info
|
|
|
Fractional Shares (Stocks) info
|
Yes
|
Yes
|
|
|
OTC Stocks info
|
Yes
|
Yes
|
|
|
Options Trading info
|
Yes
|
Yes
|
|
|
Complex Options Max Legs info
|
6
|
1
|
|
|
Futures Trading info
|
Yes
|
No
|
|
|
Forex Trading info
|
Yes
|
No
|
|
|
Crypto Trading info
|
Yes
info
|
No
|
|
|
Crypto Trading - Total Coins info
|
11
info
|
0
|
|
|
Fixed Income (Treasurys) info
|
Yes
|
Yes
|
|
|
Fixed Income (Corporate Bonds) info
|
Yes
|
Yes
|
|
|
Fixed Income (Municipal Bonds) info
|
Yes
|
Yes
|
|
|
Traditional IRAs info
|
Yes
|
Yes
|
|
|
Roth IRAs info
|
Yes
|
Yes
|
|
|
Advisor Services info
|
No
|
Yes
|
|
|
International Countries (Stocks) info
|
36
|
0
|
|
|
Order Types
|
Interactive Brokers |
J.P. Morgan Self-Directed Investing |
|
|
Order Type - Market info
|
Yes
|
Yes
|
|
|
Order Type - Limit info
|
Yes
|
Yes
|
|
|
Order Type - After Hours info
|
Yes
|
No
|
|
|
Order Type - Stop info
|
Yes
|
Yes
|
|
|
Order Type - Trailing Stop info
|
Yes
|
No
|
|
|
Order Type - OCO info
|
Yes
|
No
|
|
|
Order Type - OTO info
|
Yes
|
No
|
|
|
Order Type - Broker Assisted info
|
Yes
|
Yes
|
|
|
Beginners
|
Interactive Brokers |
J.P. Morgan Self-Directed Investing |
|
|
Education (Stocks) info
|
Yes
|
Yes
|
|
|
Education (ETFs) info
|
Yes
|
Yes
|
|
|
Education (Options) info
|
Yes
|
Yes
|
|
|
Education (Mutual Funds) info
|
Yes
|
Yes
|
|
|
Education (Fixed Income) info
|
Yes
|
Yes
|
|
|
Education (Retirement) info
|
Yes
|
Yes
|
|
|
Retirement Calculator info
|
Yes
|
Yes
|
|
|
Investor Dictionary info
|
Yes
|
No
|
|
|
Paper Trading info
|
Yes
|
No
|
|
|
Videos info
|
Yes
|
Yes
|
|
|
Webinars info
|
Yes
|
Yes
|
|
|
Progress Tracking info
|
Yes
|
No
|
|
|
Interactive Learning - Quizzes info
|
Yes
|
No
|
|
|
Stock Trading Apps
|
Interactive Brokers |
J.P. Morgan Self-Directed Investing |
|
|
iPhone App info
|
Yes
|
Yes
|
|
|
Android App info
|
Yes
|
Yes
|
|
|
Apple Watch App info
|
Yes
|
No
|
|
|
Trading - Stocks info
|
Yes
|
Yes
|
|
|
Trading - After-Hours info
|
Yes
|
No
|
|
|
Trading - Simple Options info
|
Yes
|
Yes
|
|
|
Trading - Complex Options info
|
Yes
|
No
|
|
|
Order Ticket RT Quotes info
|
Yes
|
Yes
|
|
|
Order Ticket SRT Quotes info
|
Yes
|
No
|
|
|
Stock App Features
|
Interactive Brokers |
J.P. Morgan Self-Directed Investing |
|
|
Mobile Research - Market Movers info
|
Yes
|
Yes
|
|
|
Stream Live TV info
|
Yes
|
No
|
|
|
Videos on Demand info
|
Yes
|
No
|
|
|
Stock Alerts info
|
Yes
|
Yes
|
|
|
Option Chains Viewable info
|
Yes
|
Yes
|
|
|
Watchlist (Real-time) info
|
Yes
|
Yes
|
|
|
Watchlist (Streaming) info
|
Yes
|
No
|
|
|
Mobile Watchlists - Create & Manage info
|
Yes
|
Yes
|
|
|
Mobile Watchlists - Column Customization info
|
Yes
|
Yes
|
|
|
Stock App Charting
|
Interactive Brokers |
J.P. Morgan Self-Directed Investing |
|
|
Charting - After-Hours info
|
Yes
|
No
|
|
|
Charting - Can Turn Horizontally info
|
Yes
|
Yes
|
|
|
Charting - Multiple Time Frames info
|
Yes
|
Yes
|
|
|
Charting - Technical Studies info
|
97
|
36
|
|
|
Charting - Study Customizations info
|
Yes
|
Yes
|
|
|
Charting - Stock Comparisons info
|
Yes
|
No
|
|
|
Trading Platforms
|
Interactive Brokers |
J.P. Morgan Self-Directed Investing |
|
|
Active Trading Platform info
|
IBKR Desktop and Trader Workstation (TWS)
|
No
|
|
|
Desktop Trading Platform info
|
Yes
|
No
|
|
|
Desktop Platform (Mac) info
|
Yes
|
No
|
|
|
Web Trading Platform info
|
Yes
|
Yes
|
|
|
Paper Trading info
|
Yes
|
No
|
|
|
Trade Journal info
|
Yes
|
No
|
|
|
Watchlists - Total Fields info
|
659
|
20
|
|
|
Stock Chart Features
|
Interactive Brokers |
J.P. Morgan Self-Directed Investing |
|
|
Charting - Adjust Trades on Chart info
|
Yes
|
No
|
|
|
Charting - Indicators / Studies info
|
155
|
36
|
|
|
Charting - Drawing Tools info
|
85
|
10
|
|
|
Charting - Notes info
|
Yes
|
No
|
|
|
Charting - Historical Trades info
|
Yes
|
No
|
|
|
Charting - Corporate Events info
|
Yes
|
Yes
|
|
|
Charting - Custom Date Range info
|
Yes
|
No
|
|
|
Charting - Custom Time Bars info
|
Yes
|
No
|
|
|
Charting - Automated Analysis info
|
Yes
|
No
|
|
|
Charting - Save Profiles info
|
Yes
|
No
|
|
|
Trade Ideas - Technical Analysis info
|
Yes
|
No
|
|
|
Charting - Study Customizations info
|
6
|
3
|
|
|
Charting - Custom Studies info
|
No
|
No
|
|
|
Day Trading
|
Interactive Brokers |
J.P. Morgan Self-Directed Investing |
|
|
Streaming Time & Sales info
|
Yes
|
No
|
|
|
Streaming TV info
|
Yes
|
No
|
|
|
Direct Market Routing - Equities info
|
Yes
|
No
|
|
|
Ladder Trading info
|
Yes
|
No
|
|
|
Trade Hot Keys info
|
Yes
|
No
|
|
|
Level 2 Quotes - Stocks info
|
Yes
|
No
|
|
|
Trade Ideas - Backtesting info
|
Yes
|
No
|
|
|
Trade Ideas - Backtesting Adv info
|
Yes
|
No
|
|
|
Short Locator info
|
Yes
|
No
|
|
|
Order Liquidity Rebates info
|
Yes
|
No
|
|
|
Research Overview
|
Interactive Brokers |
J.P. Morgan Self-Directed Investing |
|
|
Research - Stocks info
|
Yes
|
Yes
|
|
|
Research - ETFs info
|
Yes
|
Yes
|
|
|
Research - Mutual Funds info
|
Yes
|
Yes
|
|
|
Research - Pink Sheets / OTCBB info
|
Yes
|
Yes
|
|
|
Research - Fixed Income info
|
Yes
|
Yes
|
|
|
Screener - Stocks info
|
Yes
|
Yes
|
|
|
Screener - ETFs info
|
Yes
|
Yes
|
|
|
Screener - Mutual Funds info
|
Yes
|
Yes
|
|
|
Screener - Fixed Income info
|
Yes
|
Yes
|
|
|
Portfolio Asset Allocation info
|
Yes
|
Yes
|
|
|
Stock Research
|
Interactive Brokers |
J.P. Morgan Self-Directed Investing |
|
|
Stock Research - PDF Reports info
|
17
info
|
2
|
|
|
Stock Research - Earnings info
|
Yes
|
Yes
|
|
|
Stock Research - Insiders info
|
Yes
|
No
|
|
|
Stock Research - Social info
|
Yes
|
No
|
|
|
Stock Research - News info
|
Yes
|
Yes
|
|
|
Stock Research - ESG info
|
Yes
|
No
|
|
|
Stock Research - SEC Filings info
|
Yes
|
No
|
|
|
ETF Research
|
Interactive Brokers |
J.P. Morgan Self-Directed Investing |
|
|
ETFs - Investment Objective info
|
Yes
|
Yes
|
|
|
ETF Fund Facts - Inception Date info
|
Yes
|
Yes
|
|
|
ETF Fund Facts - Expense Ratio info
|
Yes
|
Yes
|
|
|
ETF Fund Facts - Total Assets info
|
Yes
|
Yes
|
|
|
ETF Fund Facts - Total Holdings info
|
Yes
|
Yes
|
|
|
ETFs - Top 10 Holdings info
|
Yes
|
Yes
|
|
|
ETFs - Sector Exposure info
|
Yes
|
Yes
|
|
|
ETFs - Risk Analysis info
|
Yes
|
No
|
|
|
ETFs - Ratings info
|
Yes
|
Yes
|
|
|
ETFs - Morningstar StyleMap info
|
Yes
|
Yes
|
|
|
ETFs - PDF Reports info
|
Yes
|
No
|
|
|
Mutual Fund Research
|
Interactive Brokers |
J.P. Morgan Self-Directed Investing |
|
|
Mutual Funds - Investment Objective info
|
Yes
|
Yes
|
|
|
Mutual Funds - Performance Chart info
|
Yes
|
Yes
|
|
|
Mutual Funds - Performance Analysis info
|
Yes
|
Yes
|
|
|
Mutual Funds - Prospectus info
|
Yes
|
No
|
|
|
Mutual Funds - 3rd Party Ratings info
|
Yes
|
Yes
|
|
|
Mutual Funds - Fees Breakdown info
|
Yes
|
Yes
|
|
|
Mutual Funds - Top 10 Holdings info
|
Yes
|
Yes
|
|
|
Mutual Funds - Asset Allocation info
|
Yes
|
Yes
|
|
|
Mutual Funds - Sector Allocation info
|
Yes
|
Yes
|
|
|
Mutual Funds - Country Allocation info
|
Yes
|
Yes
|
|
|
Mutual Funds - StyleMap info
|
Yes
|
Yes
|
|
|
Options Trading
|
Interactive Brokers |
J.P. Morgan Self-Directed Investing |
|
|
Option Chains - Total Greeks info
|
5
|
0
|
|
|
Option Analysis - P&L Charts info
|
Yes
|
No
|
|
|
Banking
|
Interactive Brokers |
J.P. Morgan Self-Directed Investing |
|
|
Bank (Member FDIC) info
|
No
|
Yes
|
|
|
Checking Accounts info
|
No
|
Yes
|
|
|
Savings Accounts info
|
No
|
Yes
|
|
|
Credit Cards info
|
Yes
|
Yes
|
|
|
Debit Cards info
|
No
|
Yes
|
|
|
Mortgage Loans info
|
No
|
Yes
|
|
|
Customer Service
|
Interactive Brokers |
J.P. Morgan Self-Directed Investing |
|
|
Phone Support (Prospective Customers) info
|
Yes
|
No
|
|
|
Phone Support (Current Customers) info
|
Yes
|
Yes
|
|
|
Email Support info
|
Yes
|
Yes
|
|
|
Live Chat (Prospective Customers) info
|
No
|
No
|
|
|
Live Chat (Current Customers) info
|
Yes
|
No
|
|
|
24/7 Support info
|
Yes
|
Yes
|
|
arrow_upward


